Definitions
The Definitions Menu (or comparison in Datama COMPARE) is here to set up your analysis.
Define what you are comparing (Compare, Impact & Journey).
Start & End definition: This includes both definition of the dimension you want to compare on and the segments within that dimension that defines your starting point and end point
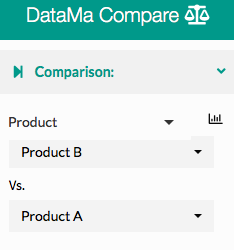
- Dimension: This can be whatever dimension is in your source, depending on your use case. Typically Period or Date, but also business unit, AB test variant, country… (in the picture below the dimension is Product)
- Start definition: This is really you’re starting point for the KPI you want to understand, i.e. what you want to compare to. It can be one or multiple possible values of the selected dimension. (here Product A)
- End definition: This is the end point of your waterfall, i.e. the observation of your KPI that you want to explain. (here Product B)
- The Start and End points represent the blue bar on the left and the right of the waterfall in COMPARE.
- Select the Dimension : Date, Device, Product….
- Then choose within the selected dimension, the segment you want to compare: 2018 and 2019, Mobile and Desktop, Product A and Product B ,….
- Click on “Compare” (or “Impact”) to get results or tap Enter
Tip: When you’re dealing with dates, a little calendar will appear next to the start and end dimensions. It can help you to select the dates more easily.
Tip: Clicking on the chart icon next to Start End Dimension gives you access to Start End Help tabset
Specify which ratio you want to assess (Pivot & Impact)
-
Define the Numerator and the Denominator of your ratio (Revenue/ Users Purchase/ Clients Margin/ Products…) - In Datama IMPACT & PIVOT, The Impact Metric is your main KPI. It will be the assessment metric that Datama will calculated to make you understand the gain or the lost you’ve made.
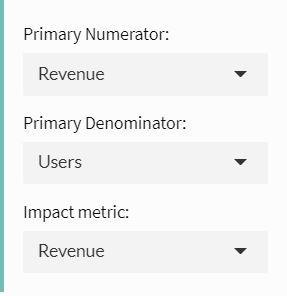
Tip: Clicking on the ‘÷’ icon next to Denominator drop down gives you access to the Ratio helper tabset