Detect - Detection methods
Anomaly detection can be based on different methods available on the shelves in Datama Detect
You have basically two type of methods existing in Datama detect to spot anomalies in your data:
- Methods based on estimated confidence interval
- Methods based on manually configured thresholds
The default value and more generic approach is the Observed volatilty. However, depending on your use case, you may want to change that input
1. Methods based on confidence interval
Methods based on confidence interval takes into account relatively complex algorithm based on your historical data to define an expected confidence interval for next points. This assumes the definition of a confidence interval which is set by default at 95%
We will use the following dataset for example on those methods
Forecast
Forecast methods leverage machine learning and ARIMA modeling to define an expected confidence interval for the latest point.
This forecast takes into account the seasonality of your data, including yearly/ monthly/ weekly seasonality
In the output slide, the forecast line is displayed in orange, and the confidence interval is in blue. Points outside the confidence interval will be considered as anomalies.
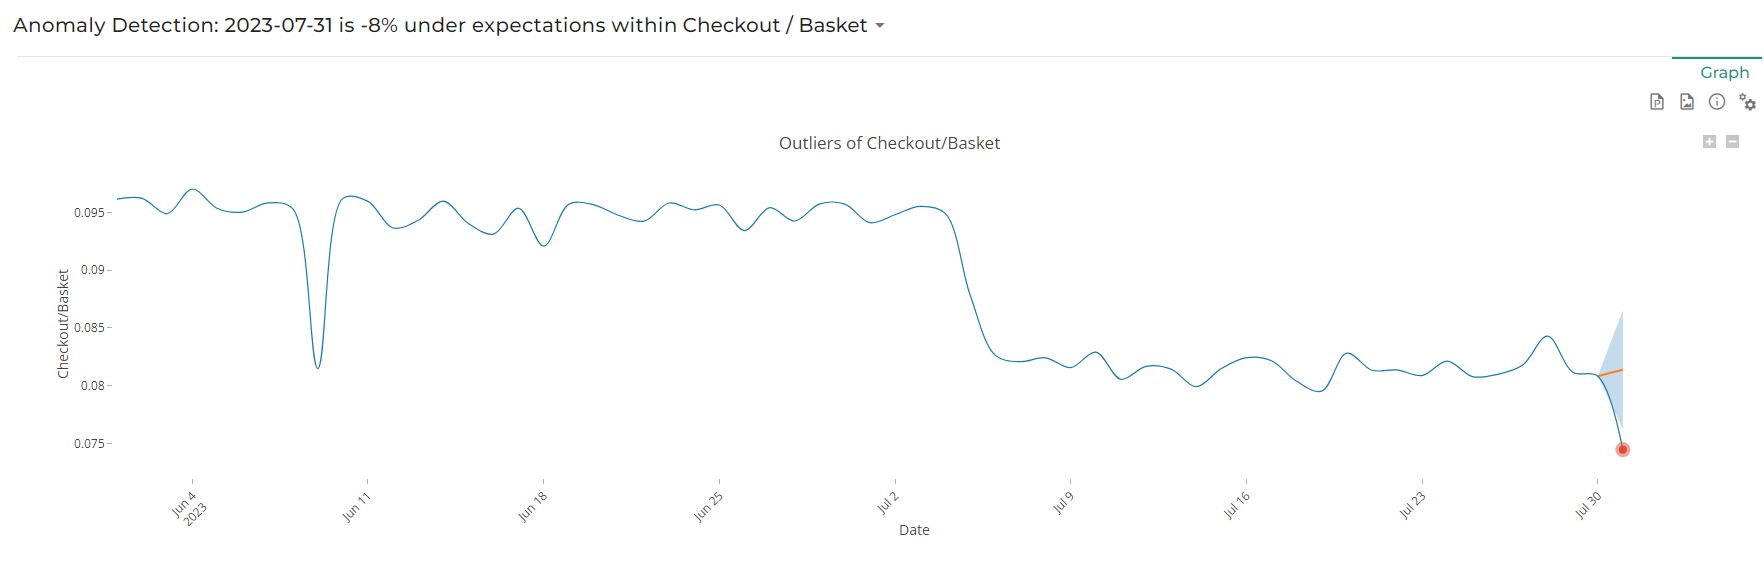
Note that Forecast method is available only when analysing latest point only
Observed volatility
The observed volatility takes into account a baseline of X previous points (X can be defined in Number of points in baseline input) and computes the weighted standard deviation and average of that baseline for a given KPI to get a confidence interval based on normal distribution rules.
The confidence interval is in light blue. Points outside the confidence interval will be considered as anomalies.
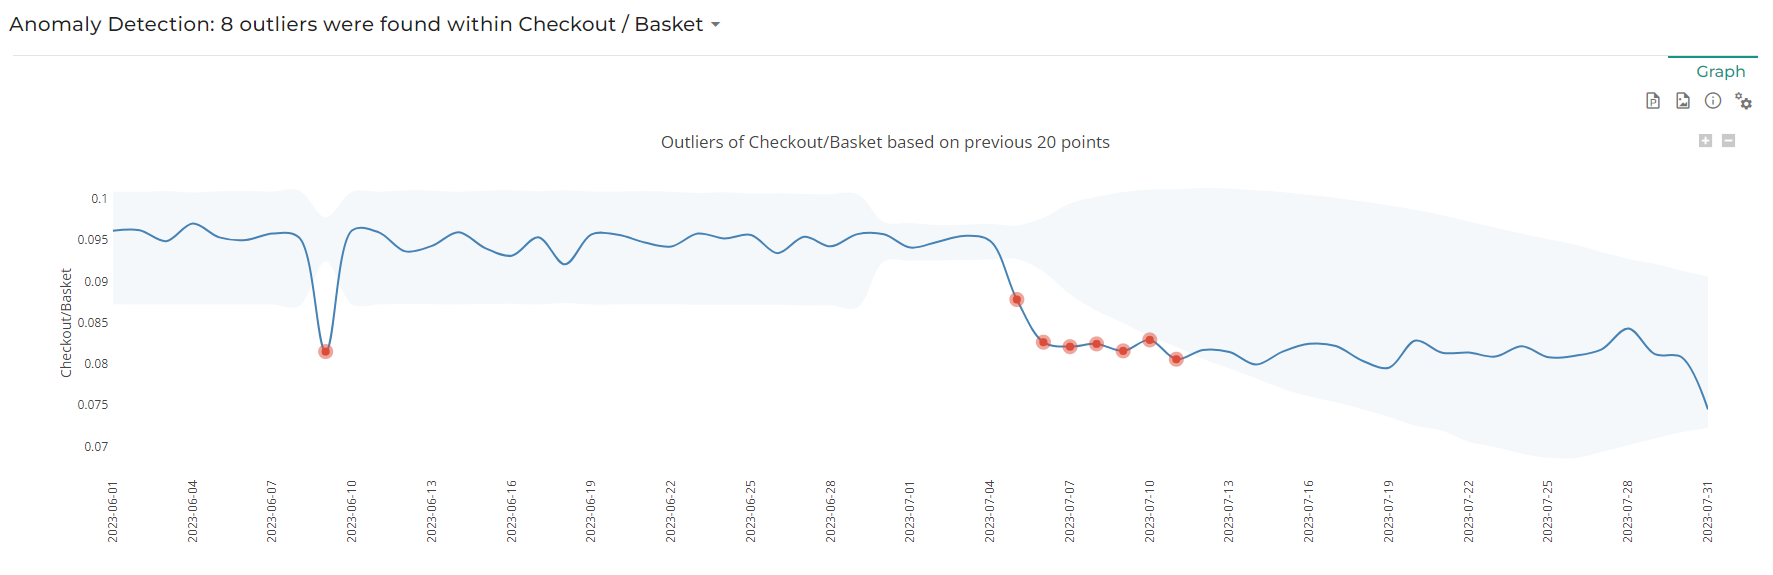
In the above screenshot, note that the number of points in baseline is set to 20, which is obvious for instance when looking as the spike of the 9th of June impact makes the confidence interval narrow down starting on the 29th of June, i.e. 20 days later.
2. Methods based on manually configured thresholds
Methods based on manually configured thresholds take into account a
We will use the following dataset for example on those methods
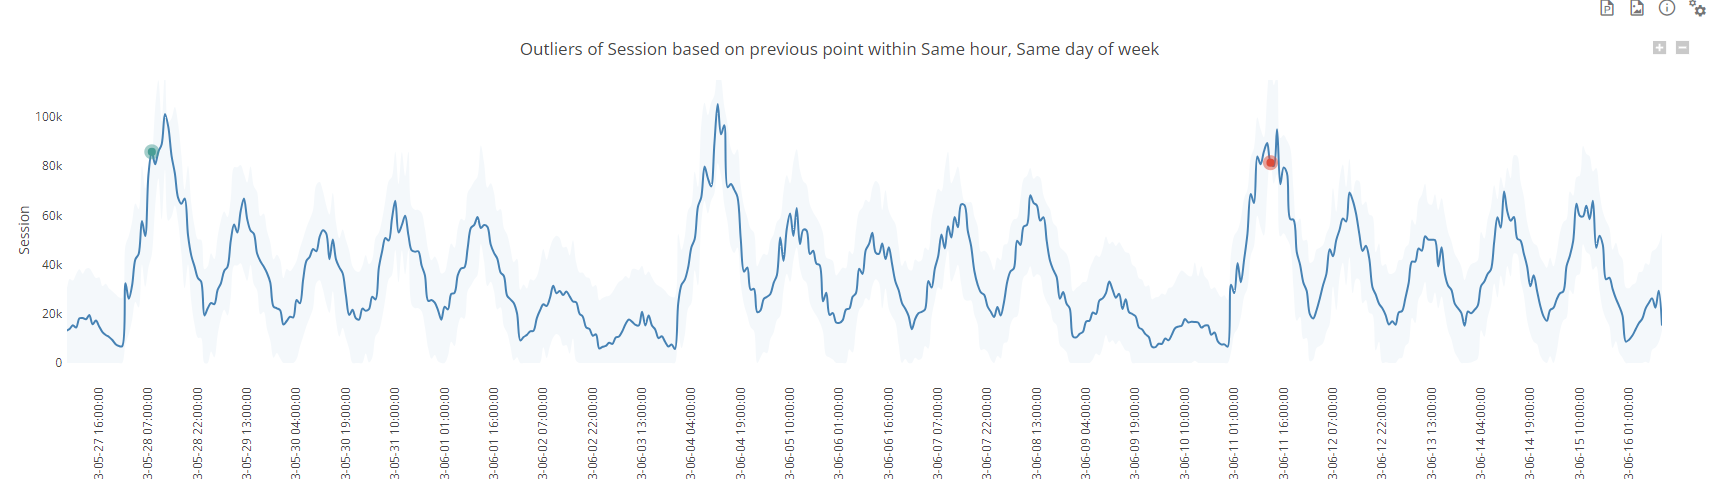
Relative variation threshold
This methods flags as anomaly any relative variation that is higher or lower than the defined threshold vs. the defined base line.
For instance, in the screenshot below, we compare each point to the previous same hour of the same day of week and if the relative variation is above or below 50%, the value will be considered as an outlier, which is the case for the latest point
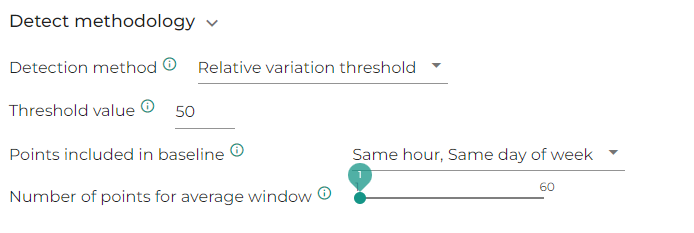
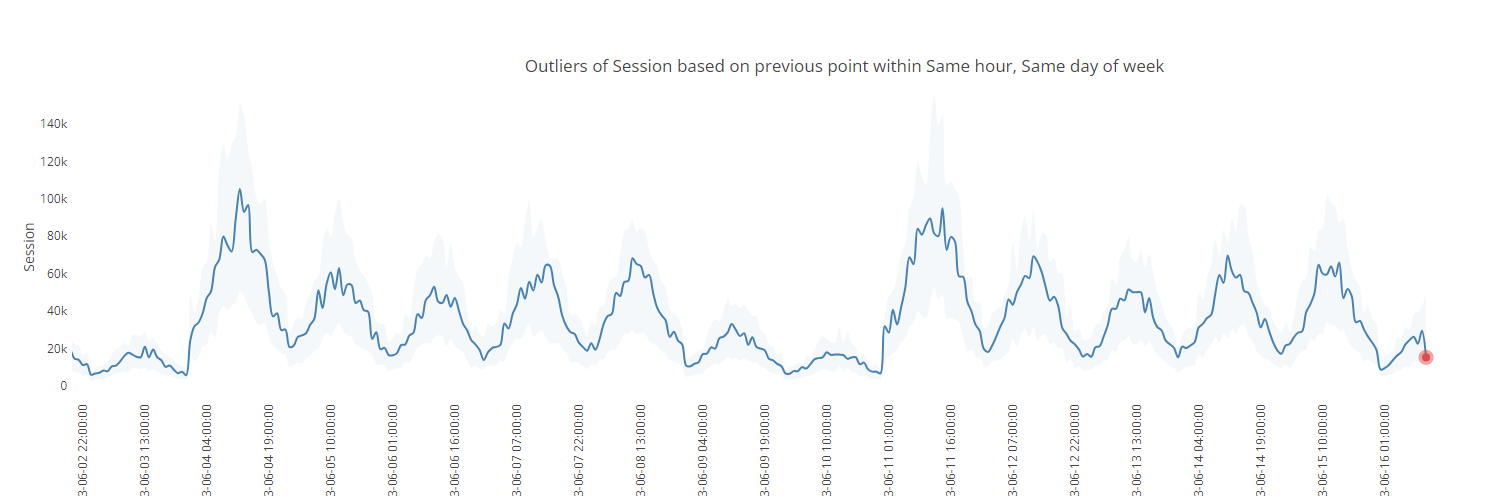
Note that in this case, threshold input is considered in % if above 1, so there is no need to put a decimal value
Also note that you might want to use more than one point in your base line, to smooth the expected value
Absolute variation threshold
This methods flags as anomaly any absolute variation that is higher or lower than the defined threshold by difference vs. the defined base line.
For instance, in the screenshot below, we compare each point to the previous same hour of the same day of week and if the absolute variation is above or below 20k, the value will be considered as an outlier, which is the case for two points
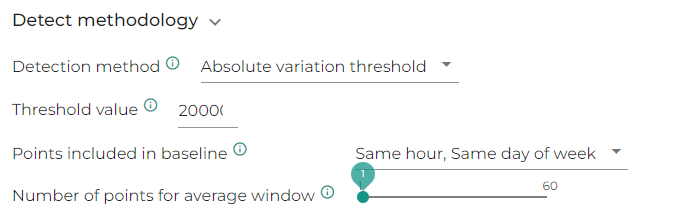
Note that the flagged outliers are not the same as in the previous relative method, which comes from the fact that there is a weekly seasonlity in the data and low values (typically weekends) have less chance to get flagged since the threshold is absolute
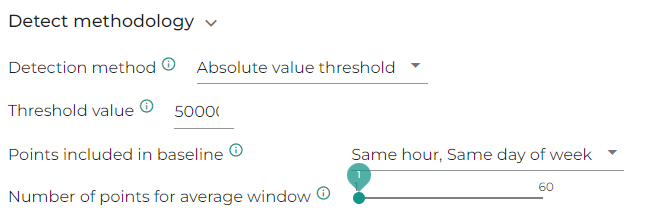
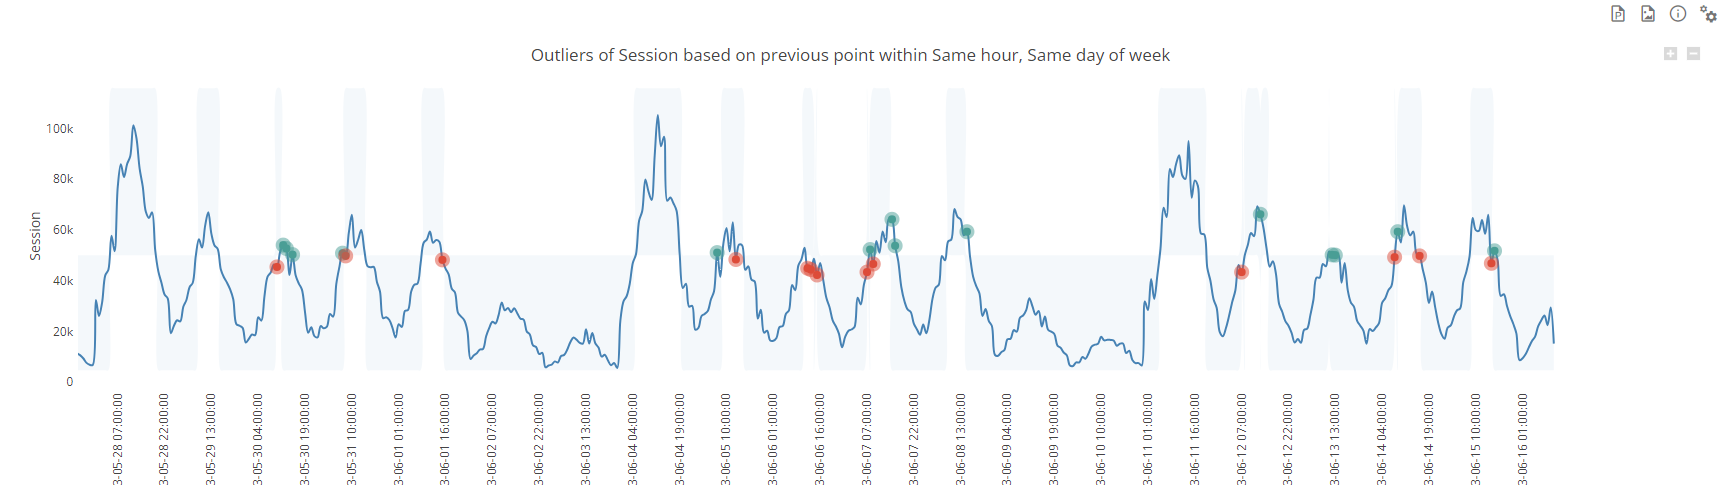
Absolute value threshold
This methods flags as anomaly any value that is not on the same side as the defined base line of the hard line defined in the threshold. For instance if the threshold is set to 50k and the base line value is 40k, if the considered value is 60k, this will be considered as an anomaly
In the screenshot below, we compare each point to the previous point and if the value changes sign vs. 50k, the value will be considered as an outlier