Pivot - Settings
Here is the different settings available in Datama Pivot
Single Dimension Clusturing:
Multiple Dimensions Clusturing:
Basic setting:s
- Comparison
- KPI (Metric Relation)
Metric relation analysis:
Find here the details of the main settings Datama Pivot
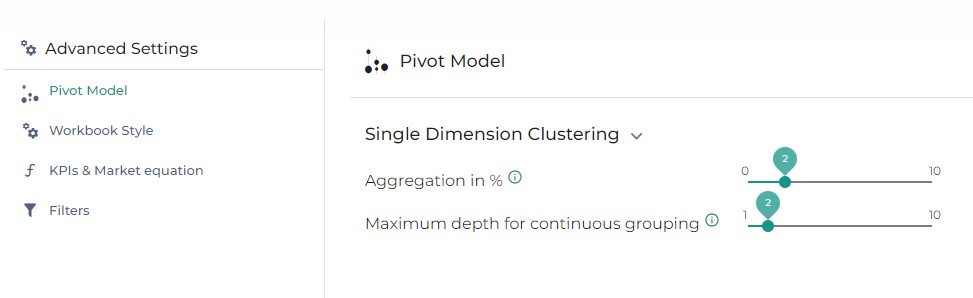
Single Dimension Clustering
Aggregation in %
The level of aggregation that the model is using – e.g. if Level of aggregation is set at X%, segment within each dimension that represents less than X% of the Primary Numerator (e.g. Revenues) of the main KPI you’re analyzing will be clustered in one « Other » segment. X is set at 2 by default, but you may want to play with this parameter quite a bit because it can change significantly the calculation of mix effects.
Click on the drop-down arrow to display the settings menu Move the cursor to the right to increase the level of aggregation Click on « Pivot » to get results Segments are now aggregated at the requested level
Maximum Depth For Continuous Grouping
For continuous elements, multiple clusters are created aggregating elements having a similar average KPI. The level of aggregation of the clustering is set by this parameter.
Multiple Dimension Clustering
Maximum Depth Of Decision Tree
The Decision Tree is not yet avalaible in the latest version of Datama Pivot
By increasing the tree depth you increase the detail of the decision tree. It will be more detailed.
Basic settings
Comparison
Datama Pivot can be used with a comparison. To enable this mode select a dimension and the element you want to compare. Each graph and the comments will be in a Compare mode reflecting the difference of the elements you are comparing.
KPI
In Datama Pivot, there is only one ratio to be defined to run the module. This ratio will be used to understand the performance of the dimensions.
Metric relation analysis
Inspect numerator only
When the toggle is checked, Pivot is focusing on the numerator of the step you are currently exploring.
Analyse all metrics relation steps
Datama Pivot can analyse one step or all the steps of your funnel. When the toggle is checked, it displays the Market equation tree slide. You can not activate Inspect numerator only in the same time.
Step interest criteria
There are different options: Value, Standard deviation and Auto.
- Value : No matter what the units are, the higher the value, the higher the importance.
- Standard deviation : No matter what the units are, the higher the standard deviation of the step, the higher the importance.
- Auto : If all your steps have the same unit, their importance is based on the Value. If some steps don’t have the same unit, the steps that are ratios are compared by Standard deviation. If all your steps are not ratios, then they are compared by standard deviation.
By default, the most interesting dimension for each step is displayed first, you can of course change the display by right-clicking on the tree.
Analysis depth
The comments summing up the market equation tree have different degrees of analysis. There are 4 different options: Low, Medium, High and Max, each option giving more details than the previous one.