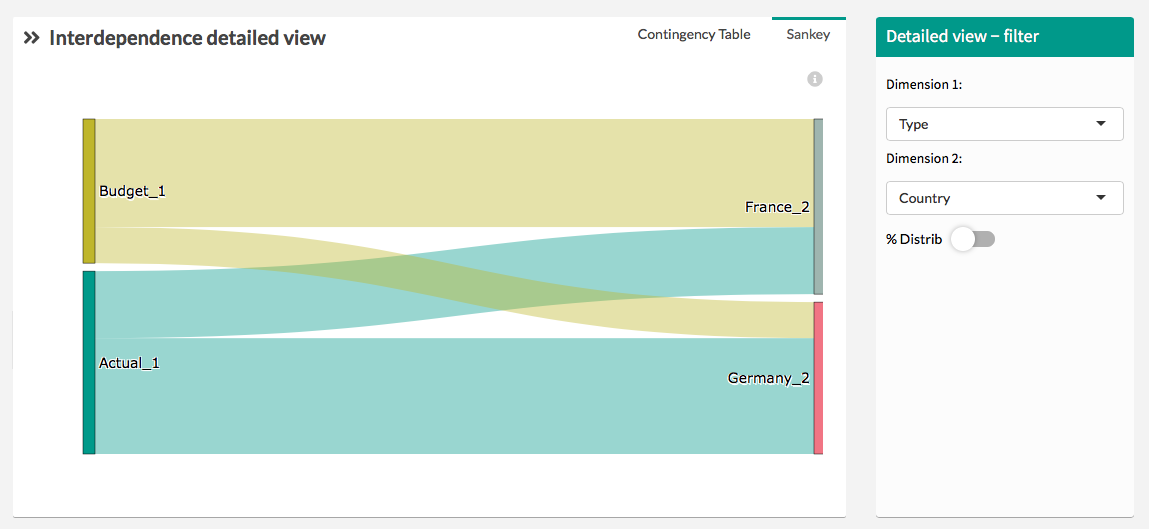
Sankey
This aims to discover how dimensions are correlated.
Show the distribution between 2 dimensions, understand for 2 dimensions how the elements of these dimensions are distributed together.
You can change dimension by using the drop-down menu on the right.
The “% distrib” option allows you to represent the distribution by percentage instead of absolute value.
This represents each element at the same size which helps you comparing the distribution.
The « % Distrib » option makes appear the segments on the right of the window all at the same size. This help to compare segment between each other.
Sankey contigency table
This table represents the detailed value of the Sankey graph. It’s the link between the two dimensions you’ve selected in the right menu