Clustering
Simple Chart
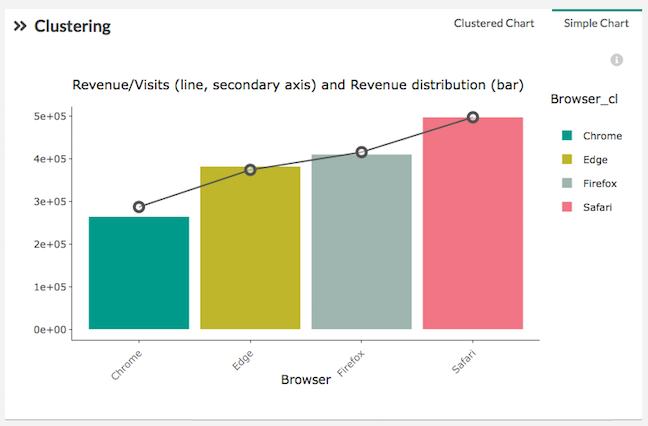
The bars show for each element of a dimension the contribution of this element to the global performance (primary numerator). You can change your dimension using the drop-down menu on the right. This is a non-aggrageted view of the data.
The black line is the average KPI of this element (ratio: numerator / denominator)
Clustered Chart
The bars show for each element of a dimension the contribution of this element to the global performance (primary numerator). You can change your dimension using the drop-down menu on the right.
The black line is the average KPI of this element (ratio: numerator / denominator)
Aggregation:
- For non-continuous elements, a cluster is created aggregating the element having a similar average KPI and representing less than “Aggregation in %” (see in the Settings menu)
- For continuous elements, multiple clusters are created aggregating elements having a similar average KPI.