User onboarding
Successfully run your 1st Datama report and learn how to use Datama Compare (and Datama Prep)
Let’s start with a simple case, with an Excel dataset. There are multiple other ways to load data.
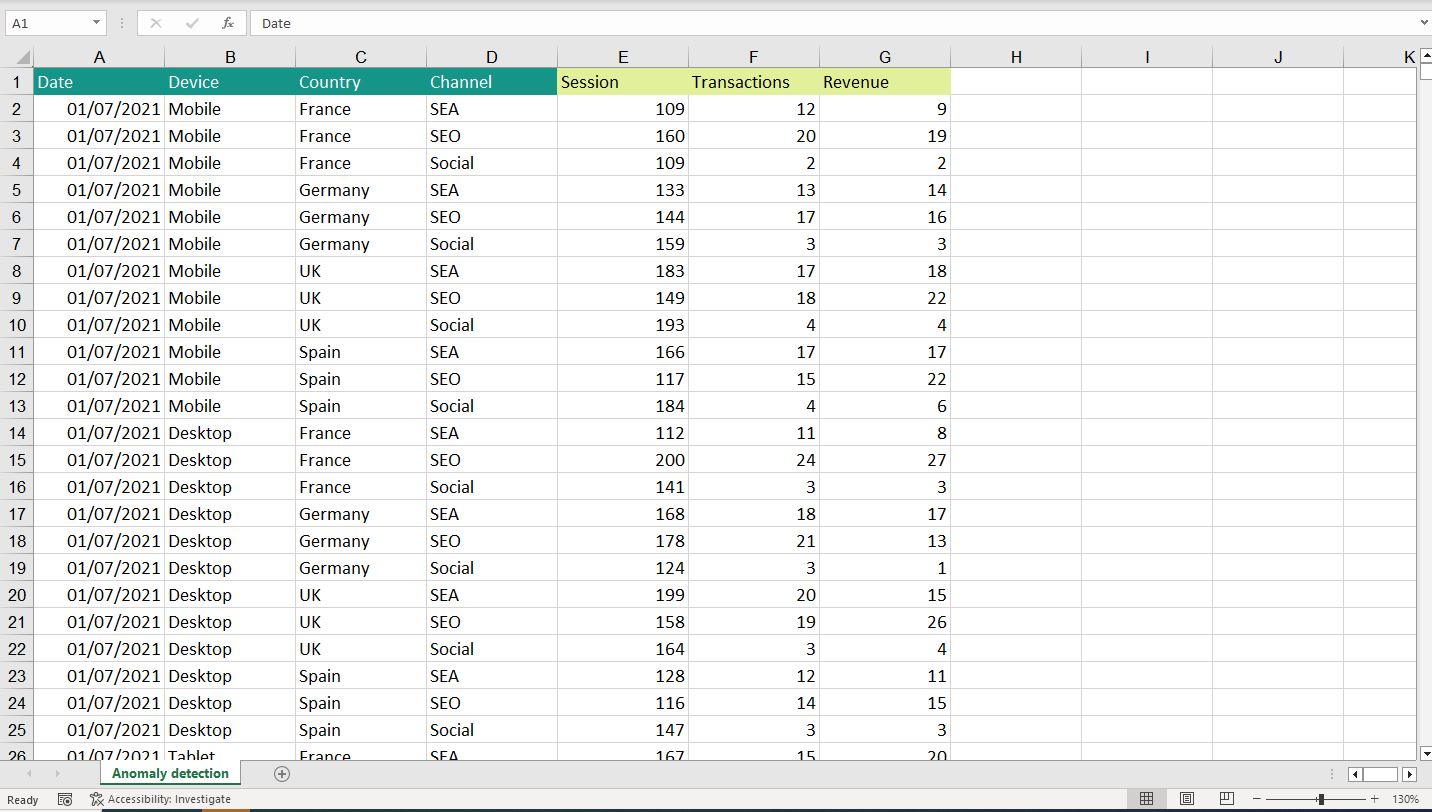
1. Step 1: Check your data
Check your columns:
- 1st column is what you want to compare (date, device, country…)
- Followed by the rest of the dimensions (if any)
- Afterwards come the metrics, quantitative columns which are summable (no ratio, %…) in the order of a funnel or what we call a “Market Equation”.
Read more about the source
In the “Get inspired” section you will find examples of workbooks in multiple areas (A/B Tests, Business Performance, Marketing,…)
2. Step 2: Create a new Workbook
Here is the Homepage of Datama with all the workbooks saved by you or your team
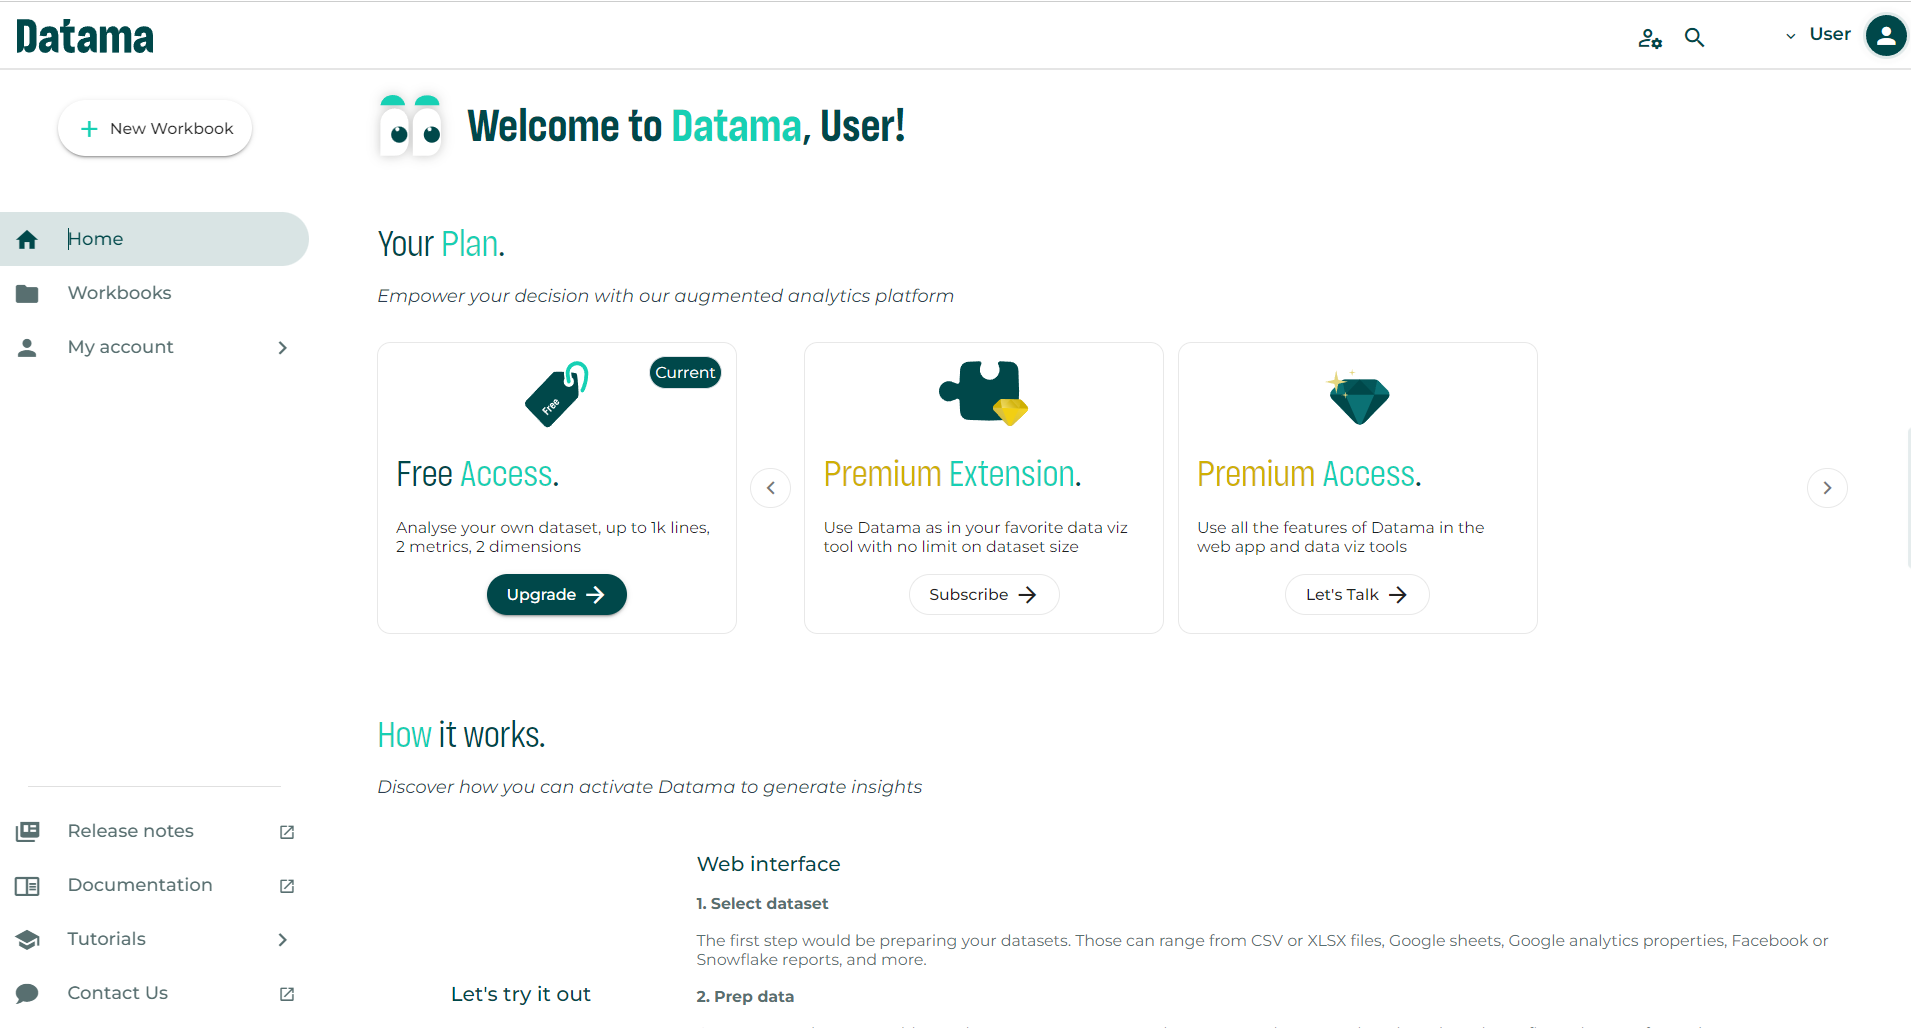
Click “Add new workbook” to access Datama Prep and connect (or load) your data.
3. Step 3: Add your source to Datama Prep
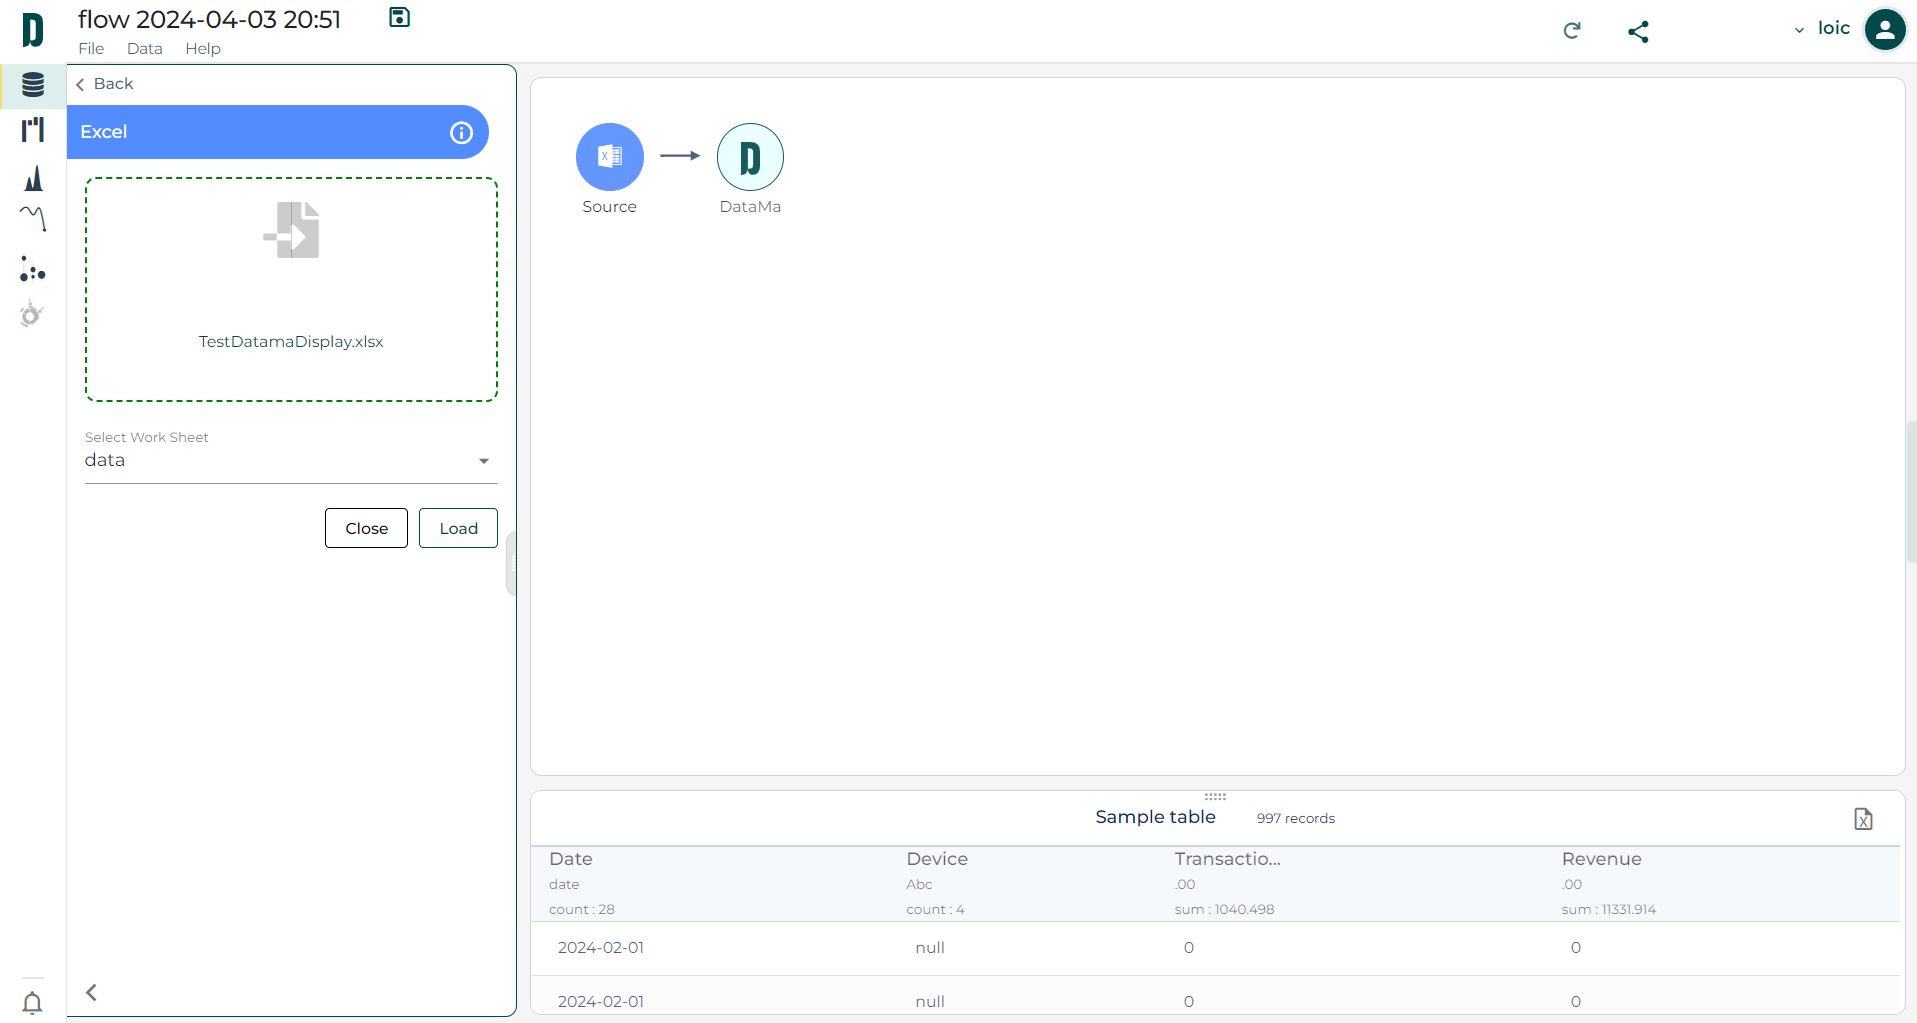
From the list of available connectors, select the one that matches your data source
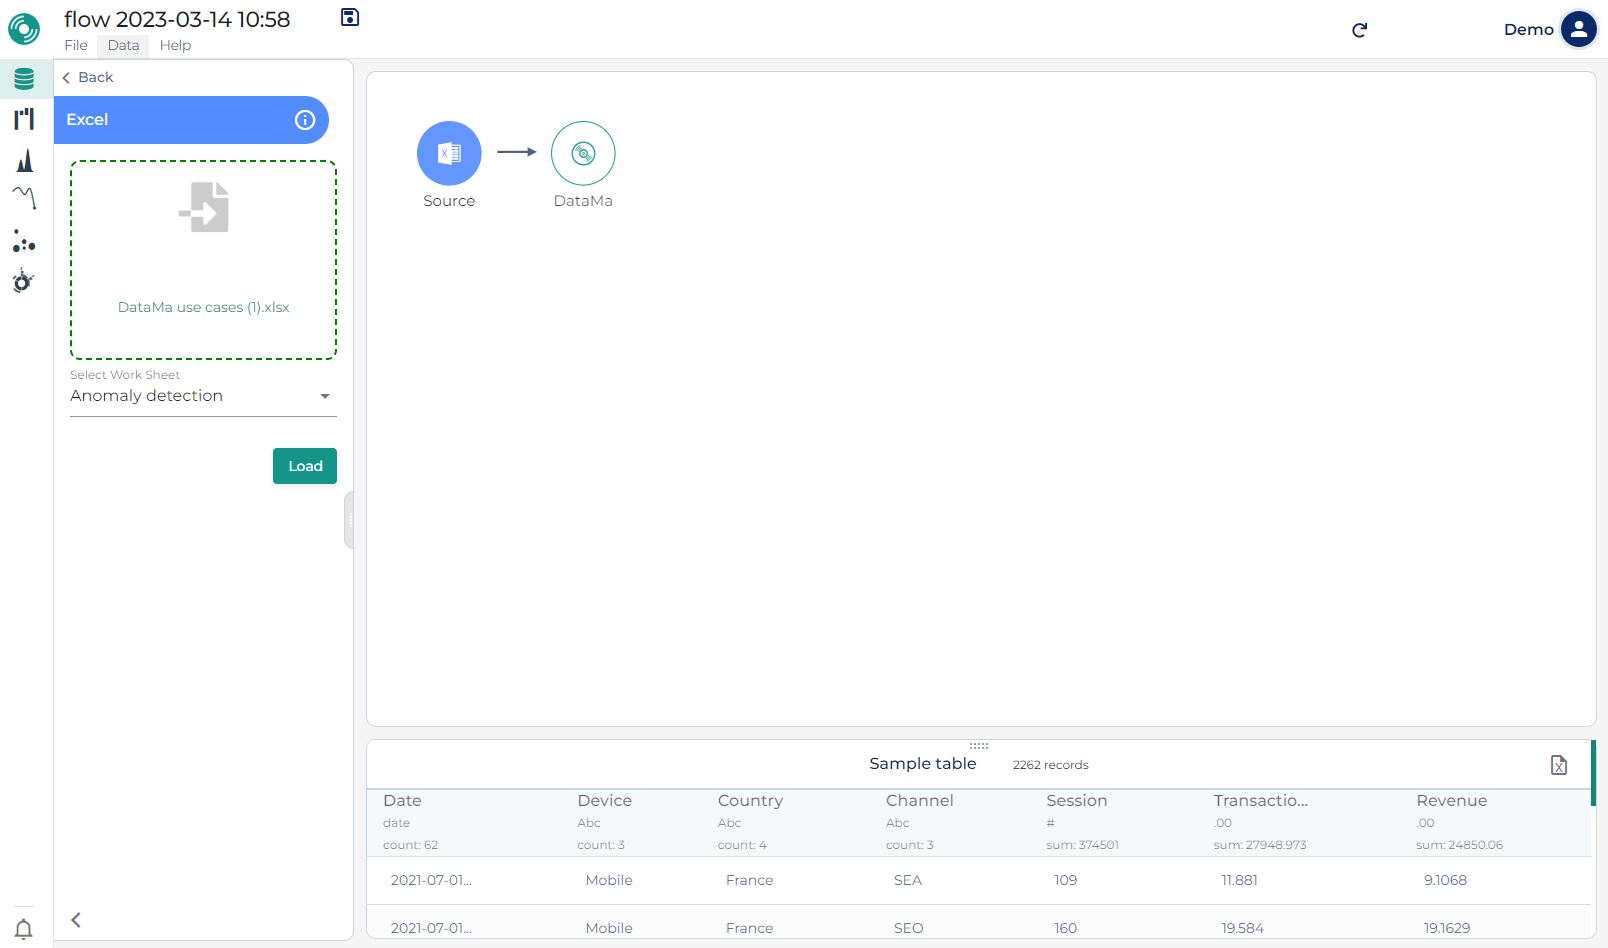
4. Step 4: Check your Column and define your steps
In the Datama output block:
- Select the columns that should be considered as Dimensions and Metrics
- Define the steps of your metric relations and refine your case (adapt name, define a unit, or a threshold,…)
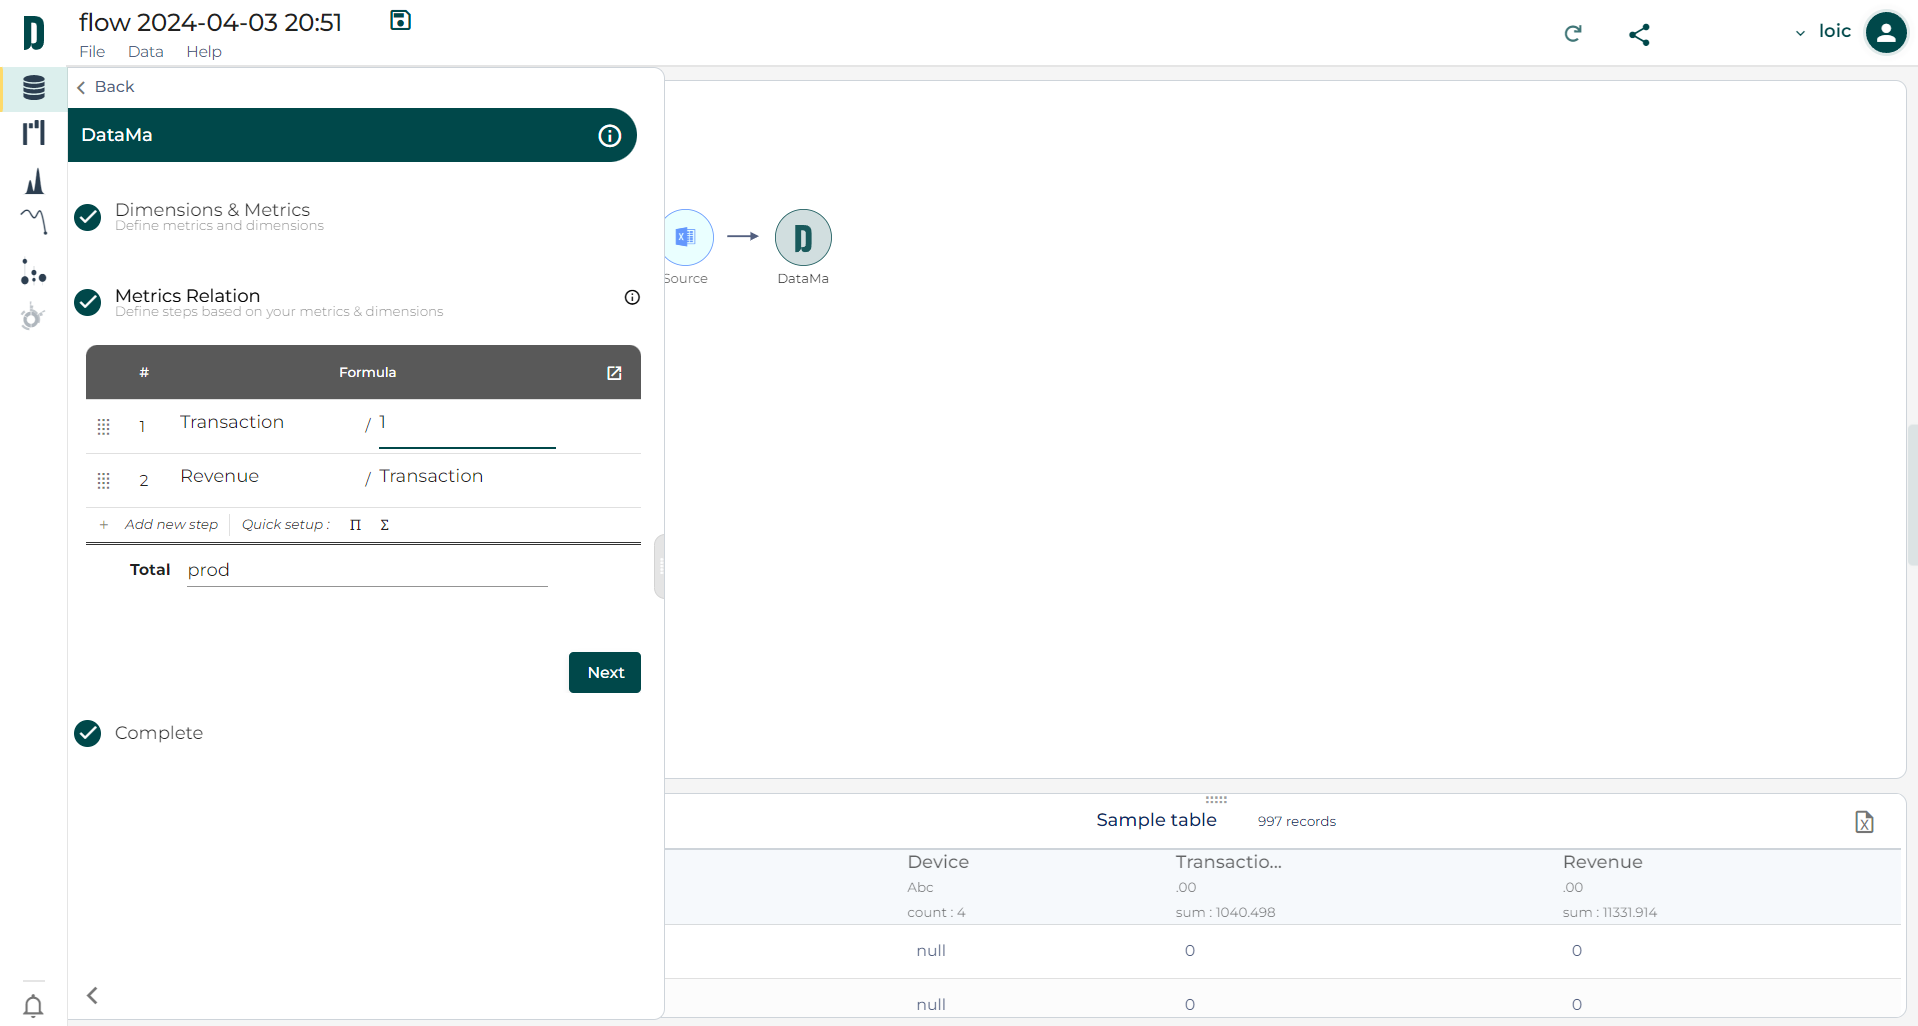
If your dataset is properly split between dimensions and metrics, and the metrics relations makes sense, you can select a Datama solution.
5. Bonus 💎: Intro to waterfall analysis
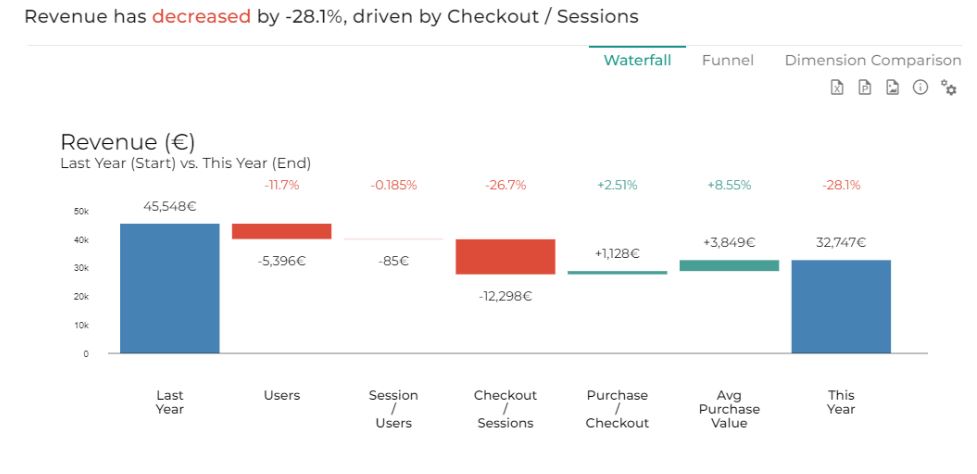
5.1 What is a waterfall graph ?
A waterfall allows you to quickly identify and understand the factors that cause your performance indicator to rise or fall from Start to End
- For example, this waterfall below is explaining the gap of -28,1% in Revenue from last year (45,549€) to this year (32,747€)
- Each step is a variation that explains the gap of -28.1% (mainly due to -11.7% of Users and -26.7% of Checkout/ Session)
- When the Checkout/ Sessions drops from -26.7% it has an impact of 12,298€ on Revenue
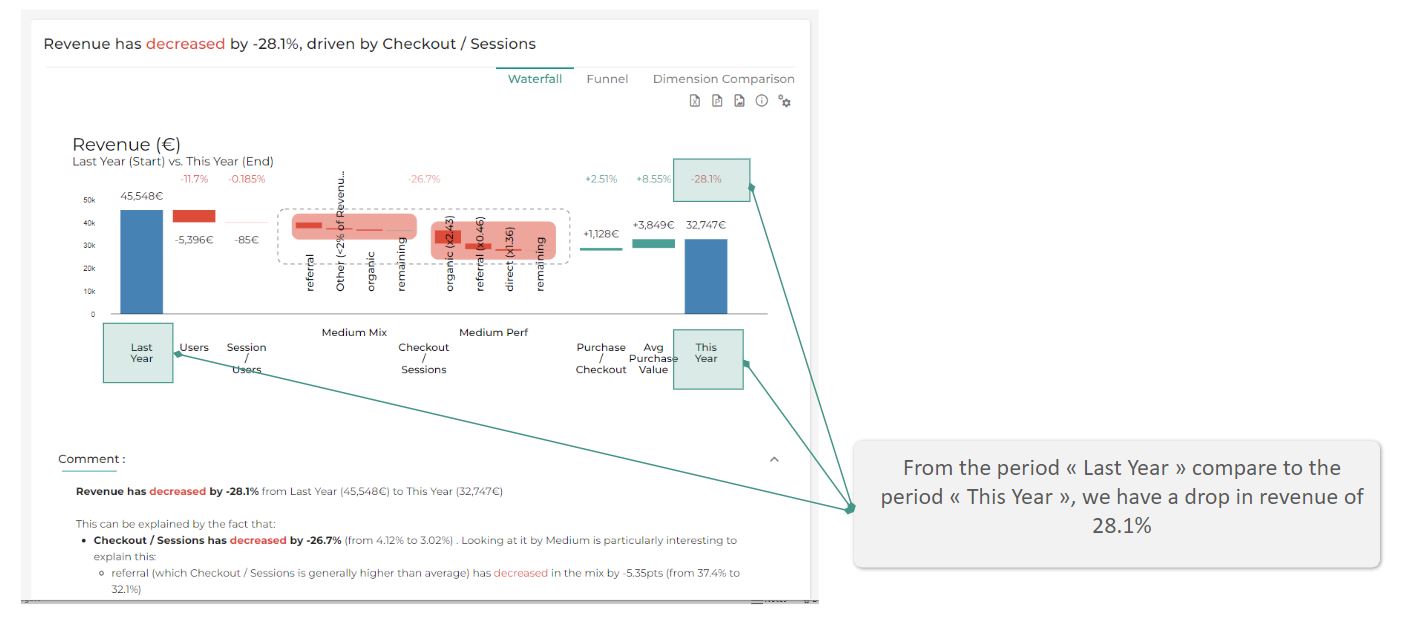
After seeing the quantitative variation of your Revenue, it’s time to understand what causes this variation.
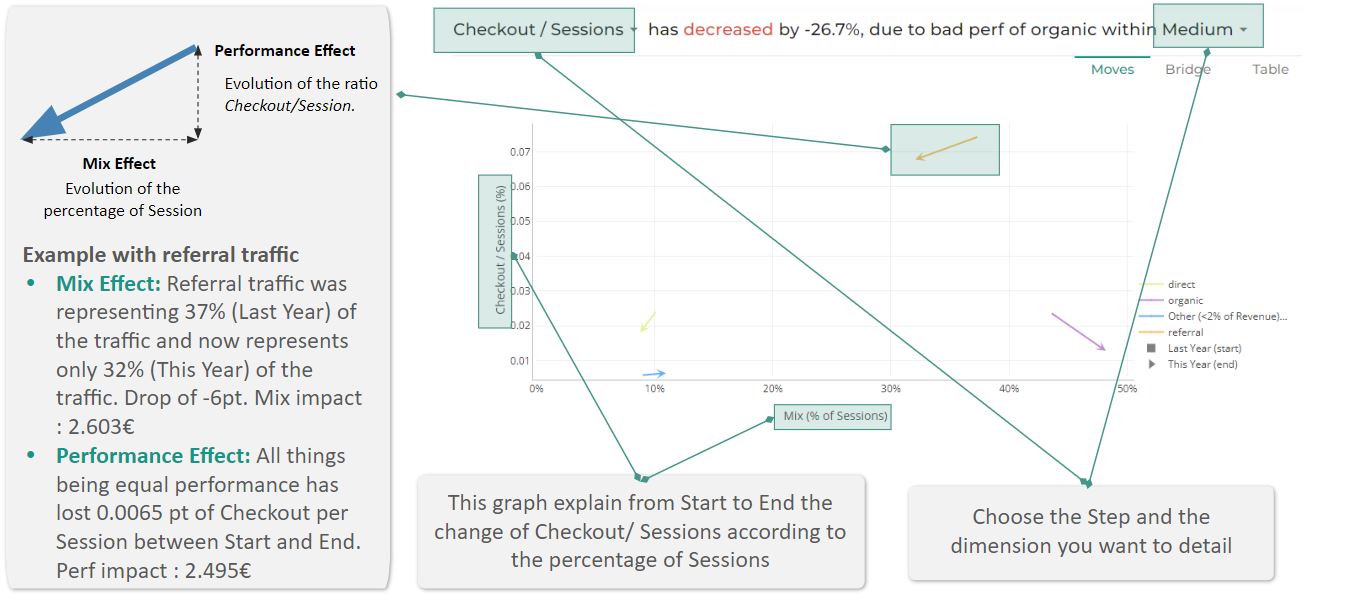
By clicking on a step, the graph displays the dimension that mainly explains the gap and the impact each element of this dimension has on that variation.
Each variation is split between mix and performance (see article or the next section to understand the difference)
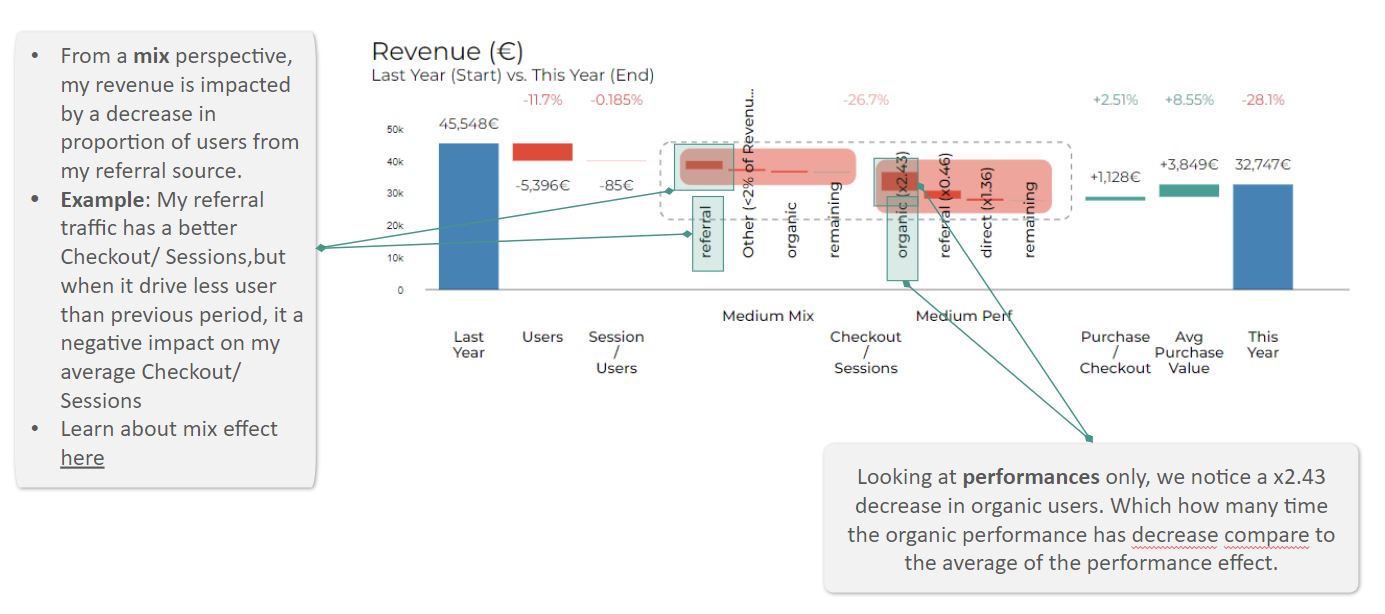
5.2 The Moves « graph » is a representation of both Mix & Performance effect
If you have any further questions to create your Workbook, please contact us