Prep - Refine data
This section helps you to refine your data in Datama Prep
Find here how you need to format your dataset for Datama solutions.
Here are the available actions you can do so far in Datama Prep to refine your dataset:
1. Clean
Clean action allows you to edit order and types of your columns.
Why ?
Because you might need to append later on this dataset with another one, and you will have to coordinate both of their characteristics (such as the name of the metrics and dimensions, their format etc) so that they match in your dataflow afterwards. This is necessary to create a functionnal and interesting market equation, which is the foundation of Datama’s solutions.
How to use it ?
You can adapt your dataset and transform it in the right format so that its lines and columns concur with other datasets.
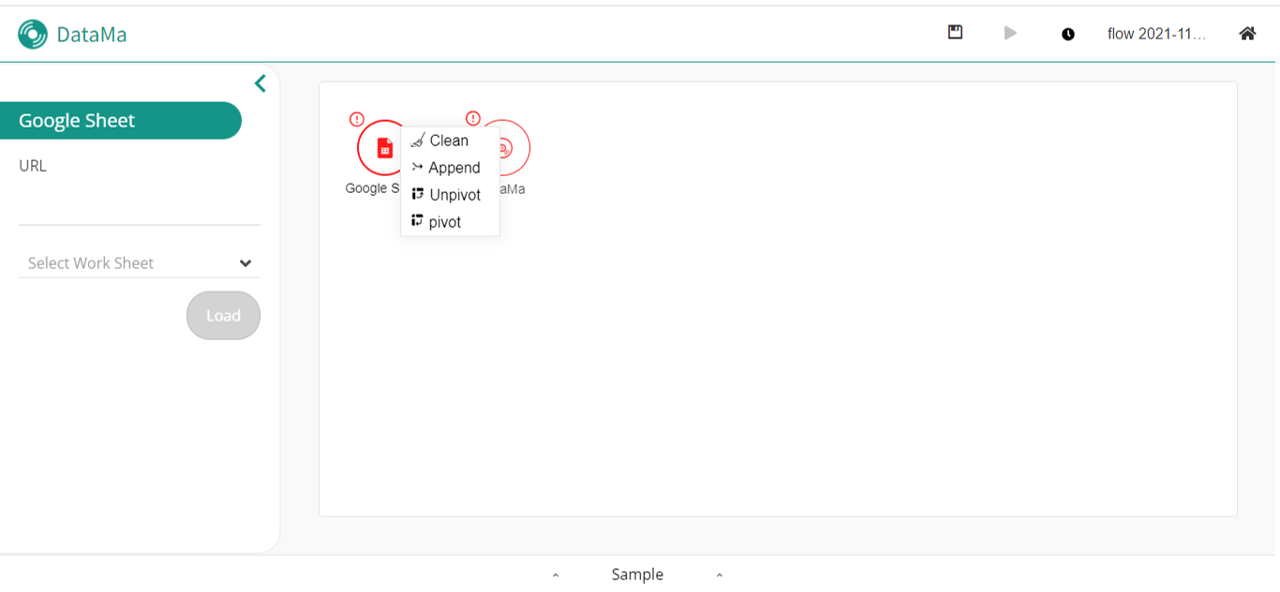
In the action menu, you can select the “Clean” option to use it.
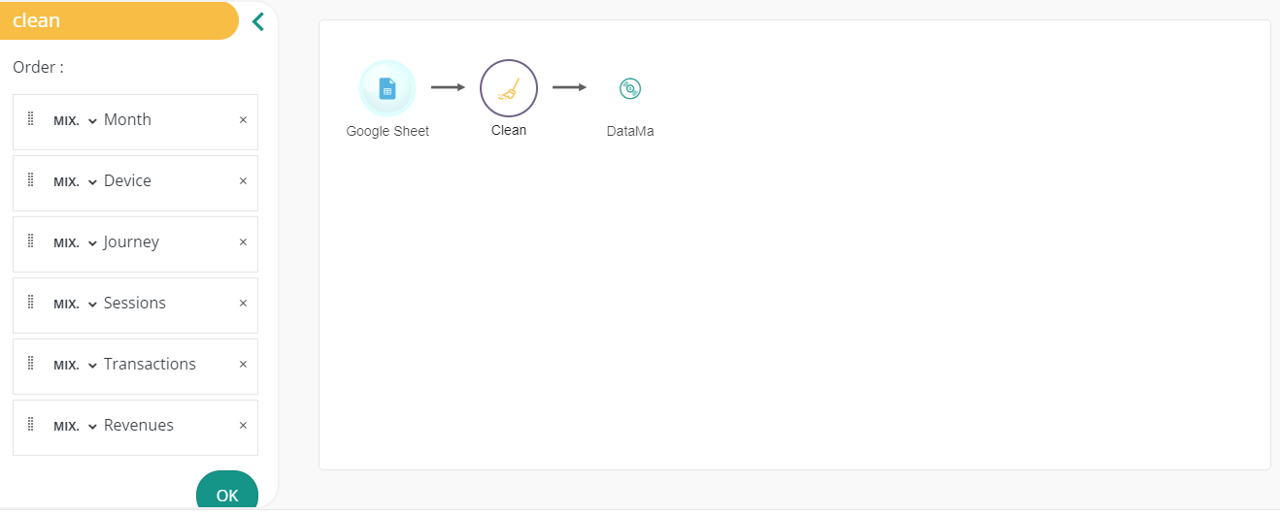
Once the block is created you will be able to see all of the existing columns generated by the previous action.
Configuration explain
When you click on the Clean action block, you’ll be able to see the configuration menu on the sidebar as a list of columns corresponding to the previous action on a dataset. Thus, you’ll be able to:
- Re order dataset’s columns by using Drag and Drop on items
- Rename a column by editing directly in the item it name
- Remove a column from the dataset using the × button
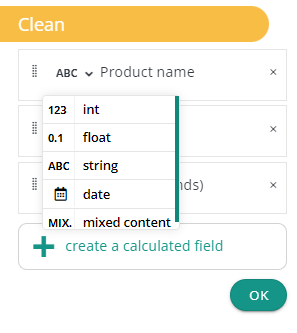
You’ll also be able to edit a column type by using the select contain on items. If the conversion is not possible, for example converting a product name such as “hair dryer” to a date type, the clean action will show a warning.
1.1 Calculated fields
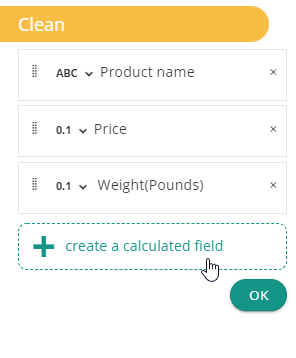
In addition, Datama prep gives you the possibility to create Calculated Field using the Create a calculated field button. See more on the available functions.
Then, you edit like:

This a powerfull tool to create columns using conditionals or aggregation functions without the need to manually edit your dataset. Once you’re done make sure to click on the “Ok” button to validate the creation of the calculated column.
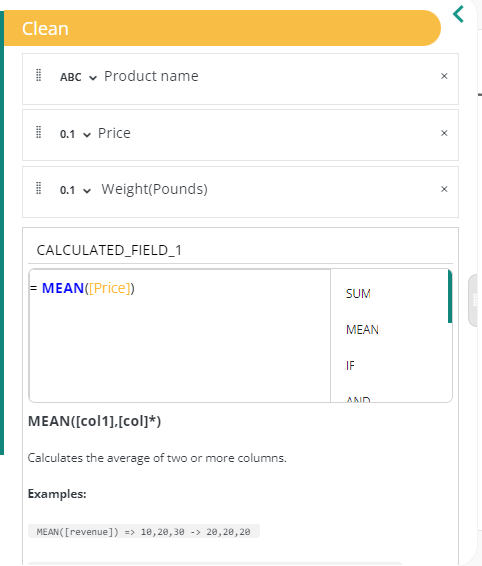
To edit your calculated fields, the detailed functions list is available here
1.2 Cluster dimension
Finally, prep also gives you the possibility to cluster some columns of your dataset using the Create a clustering field button.

Below an example of what the form looks like:

As you can see in the example shown above, you can configure several parameters in the clustering form:
- Enter a name for the new column in the “Column name” field.
- Select the column you want to cluster from your dataset in the “Column” field.
- Choose the clustering method to apply in the “Clustering Method” field (for more details, click here).
- Select the metric for the computation in the “Metric used for clustering” field.
- Adjust the clustering settings (for more details, click here).

Tip of the Week 132: Cluster dimensions your way!
Want to cluster certain values in your dataset before analysis? For instance:
- Group small countries generating less than 3% of your revenue in a “Other” bucket.
- Group ages into ranges (example: 18–24, 25–34) for easier analysis. You can now compute Clustering Fields in Datama Prep using the “Clean” object. This feature allows you to group unique values from any dimension column into buckets using methodologies like Long Tail Aggregation or Regression Partitioning. It’s especially useful for large datasets!
🔧 3 Simple steps to get it done:
- After loading your dataset into Datama Prep, click the “+” icon at the top-right corner of the “Source” object, then select “Clean” 🧹
- Customize your Clustering Field: edit the group column name, select the base column and define your aggregation method on the left 📝
- Apply and save changes: click “Apply” at the bottom-right to instantly see the new aggregated column ✅
🎥 Check out our GIF guide for a step-by-step walkthrough.
📊 Refine your data preparation—your way!
2. Append
Append action allow you to merge two source flow in one.
Why ?
Datama Prep allow you to import data from multiple source to a single output ready for Datama Core’s solutions. In order to join our multiple source we need an Append action.
How to use it ?
For instance, if you have input a Google sheet and a Google trend file, you might want to make a fusion of both of their data.
To do so, in the action menu of the block where you want to merge datasets select “Append”. It will automatically merge datasets.
On the sidebar, you can also notice the summary of each of the dataset’s columns.
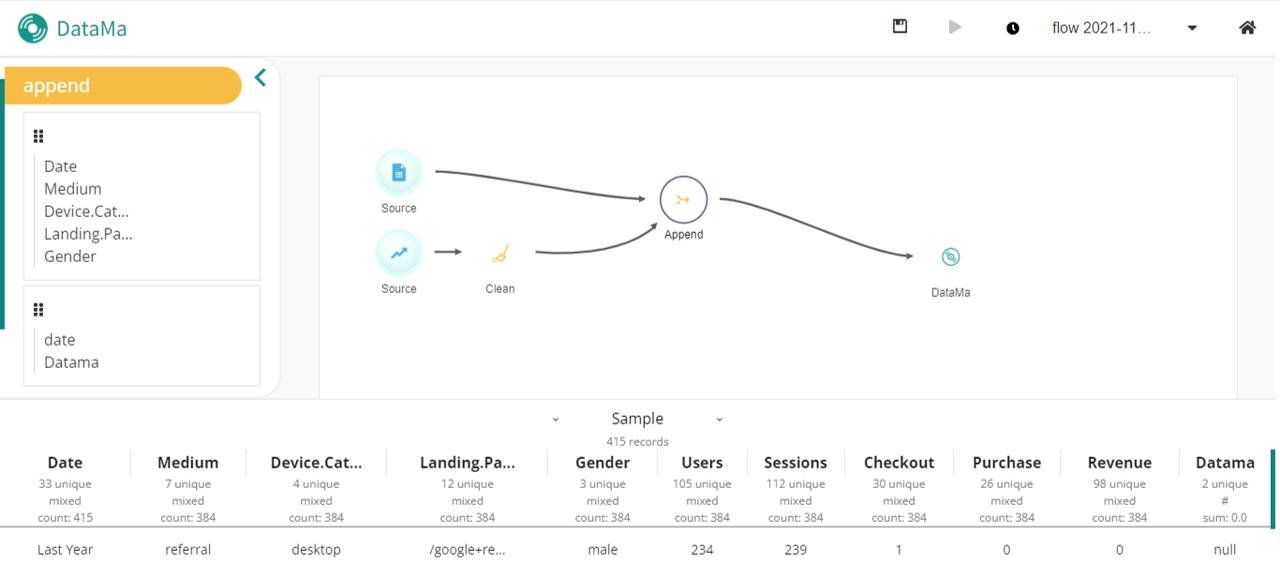
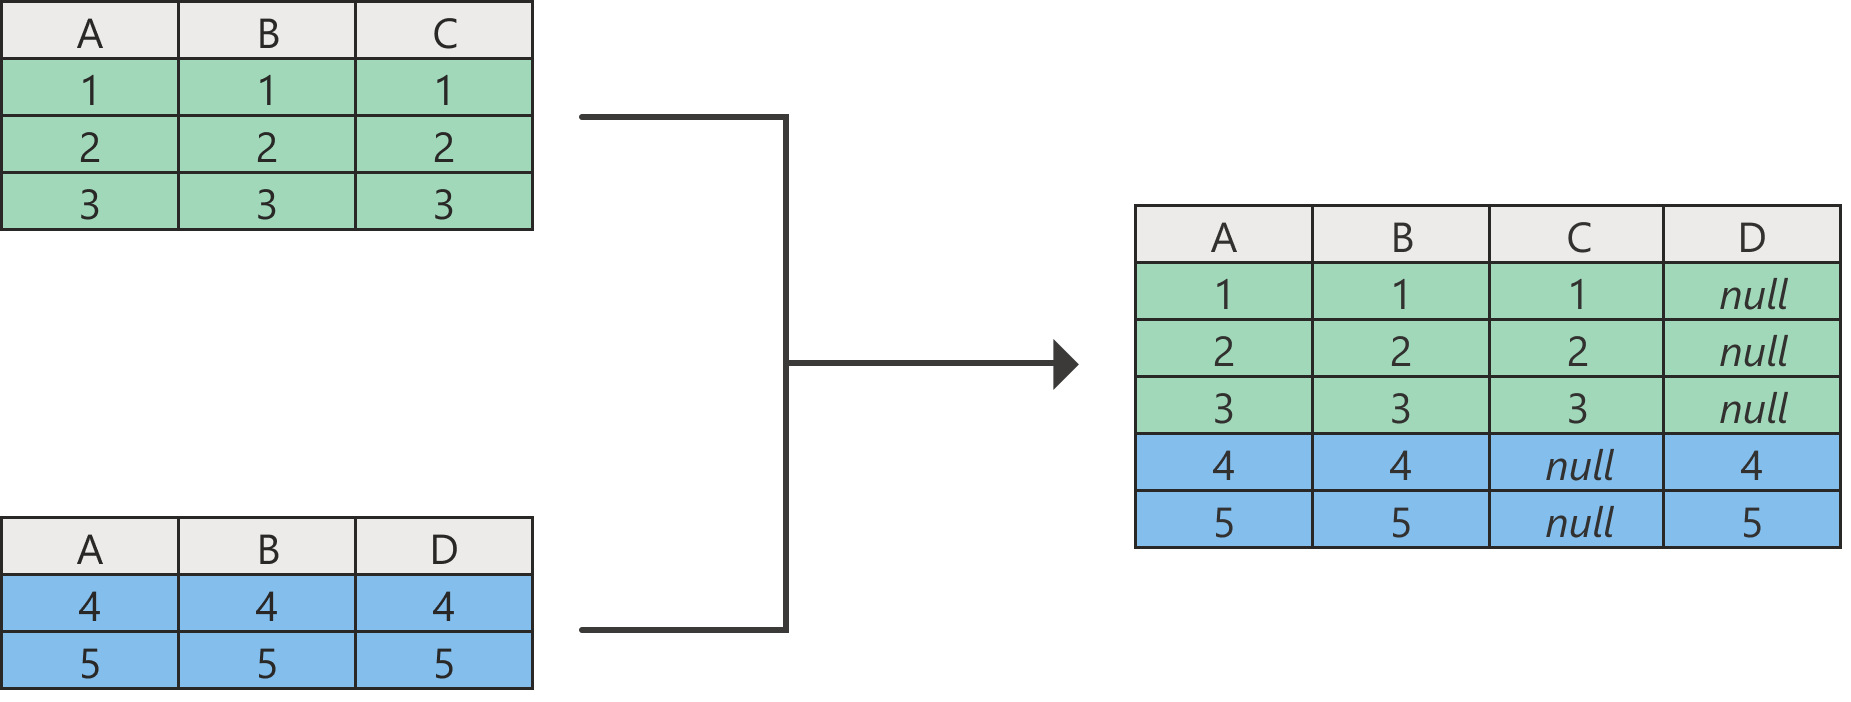
If there are some columns shared between both dataset, it will merge them instead of duplicate them (careful it’s case sensitive). All non-shared columns of each dataset will be seed with NULL value.
This is not a JOIN, it acts like putting one dataset below the other.
Filling NULL values
To ensure consistency and enrich your data, Datama Prep provides an option to fill these null values. Let’s see how it works using the following example:

After appending the datasets, activate the Fill in null values toggle.

By default, a menu appears showing pre-matched metrics between Dataset 1 and Dataset 2. These pairings serve as key-value pairs to guide how missing dimensions are filled.
- You can modify existing pairs to better fit your requirements.
- You can add or remove pairs to ensure all relevant data is accounted for.
In our example, “Traffic IT” is paired with “Session GA”, and “Transaction IT” with “Transaction GA”, meaning for example that “Traffic IT” will be distributed on missing dimensions “Country” and “Device” using the values of “Session GA”. It is important to note that the sum of each column does not change, we just distribute each metric according to the values in its pair.
The result with our example is the following (each color corresponds to the same sum):


Distribute missing segments
Finally, if one segment is missing from one dataset to another, let’s say that in our example, Dataset 1 has an additional row:

You have the possibility to distribute this missing segment as well, by activating Distribute missing segments toggle (deactivated by default). To distribute this segment, we divide the initial value (40 for “Traffic IT”) by the number of rows to distribute (here 4). It follows:

3. Join
A basic reminder: Append combines the rows of Table A and Table B when their column names are the same. Join adds columns from Table B into Table A when there is at least one common column. Here’s an example:

Datama allows you to inner join two or more tables by default. You can choose the type of join here:

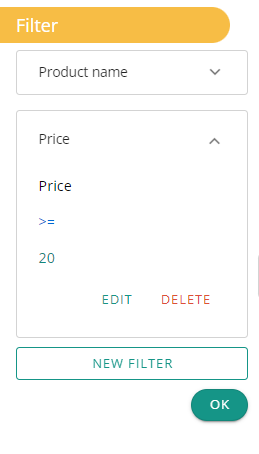
3. Filter
Filter action allow you to filter data in columns.
Why ?
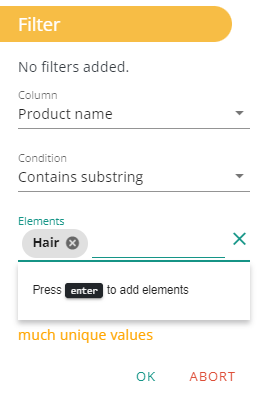
Let’s say you want , from your dataset, to fetch products where the “product name” contains ‘Hair’ and the “price” is above $20. The filter action helps you do such tasks so you don’t need to do them manualy.
How to use it ?
By using the button “new filter” you must first choose the desired column.
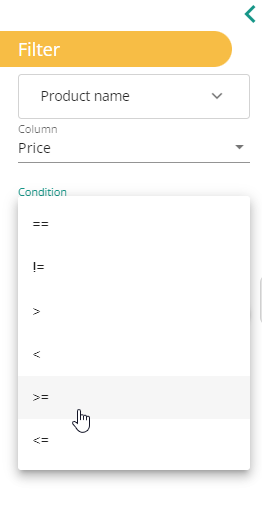
Then make sure to choose the appropriate type of filter. For text base data the currently availbalbe filters are:
As for numbers and dates:
Finally you have to add one or more elements to be used to apply the filter on the column.
A filter action holds a single filter condition on each field and works by applying a logical OR to the column data. It’s possible to chain multiple filters which will be the equivalent of using a logical AND on each simillar column.
Once you have some filters applied you can see them by their column name. By clicking on it you open it and see a description of the filter.
Sometimes you can see the following error message “It seems that there are too many unique values” it means that the number of unique values in the dataset is higher than the limit set by Datama.
This was implemented to avoid application performance problems.
It has the effect of not offering the unique values in the filter value selector.
4. Pivot & Unpivot
You might want to pivot and unpivot your dataset in Datama PREP.
What is that for?
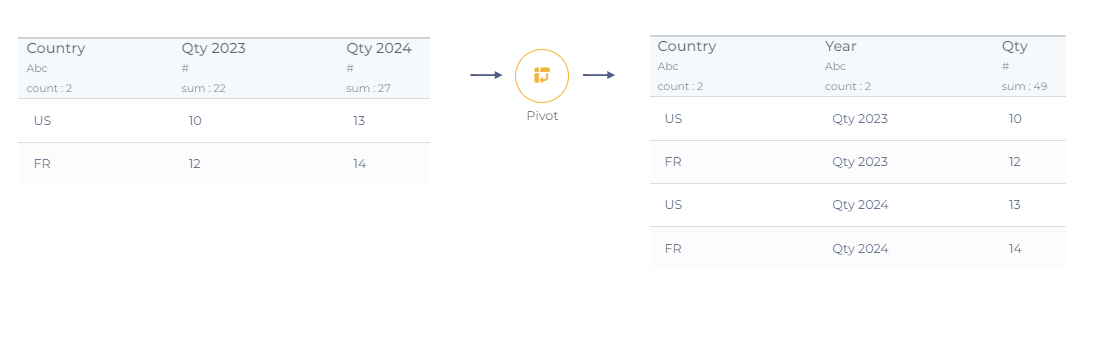
Pivot operations
A pivot table is a table of grouped values that aggregates the individual items of a more extensive table within one or more discrete categories. This summary might include sums, averages, or other statistics.
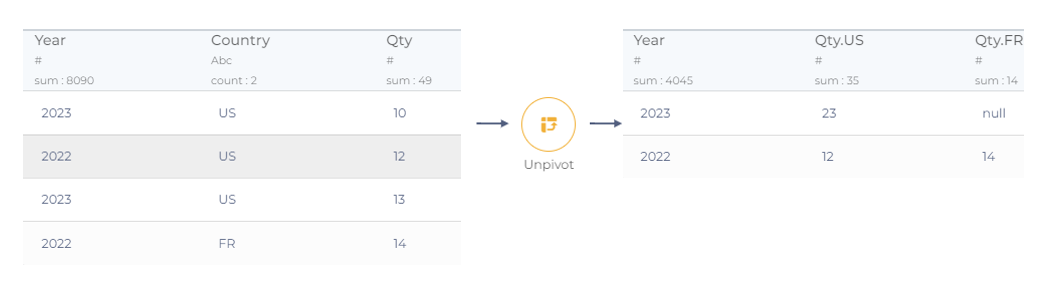
UnPivot example
We have a column gender containing only two unique values, {males, females}. We want to split sessions according to those values. To do so, we will unpivot the column gender using sessions as an aggregates column.
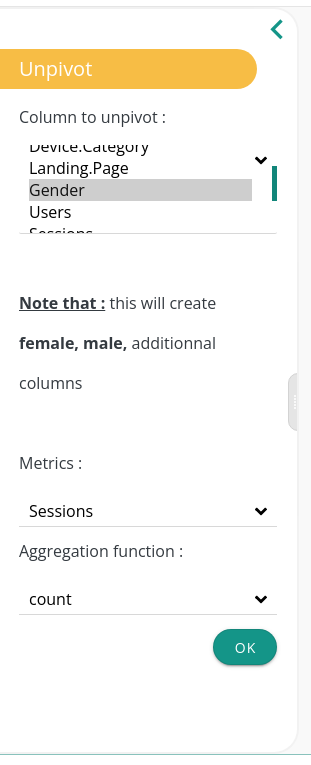
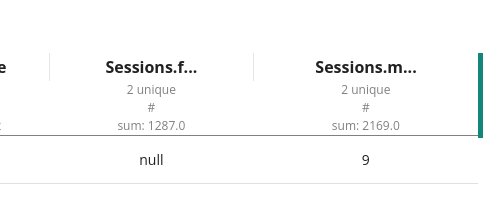
For example, this unpivot configuration creates two columns {Sessions.female and Sessions.males} containing the same values but in two distinct columns.
5. What if
What if allows to create scenarios with simulated data based on simple assumptions
“What if” block allows to create scenarios on your existing data, taking assumptions on variations of KPIs on a given scope. This is particularly useful for Compare usage, when trying to get an idea of an the impact of a simulated change on a total KPI.
Important: Note that the simulated impact on total KPI is purely linear and doesn’t take into account the potential elasticity between KPIs. For instance, doubling your price in “What if” block will likely double your revenues, while it’s obviously not the case in reality. So What if scenario should be kept for high level sizing or small changes.
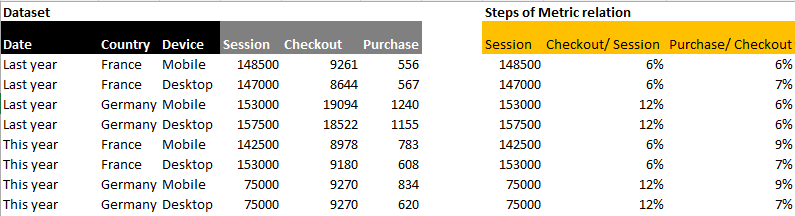
For the following documentation, we will take an example of an ecommerce website that has 3 steps in its market equation: Purchase = Session x Checkout/ Session x Purchase/ Checkout The team wants to understand what would be the impact of increasing the Checkout/ Session average of Mobile users by +1pt on the total volume of purchases, based on Last Year data. The initial dataset is as follows:
What if scenarios are made of 2 main parts
- The Baseline
- The impacted KPI(s)
Tip of the week 136: Use the Datama What if block to test your hypotheses!
Want to see how changes in attributes affect KPIs ❓
Datama What if block in Datama Prep allows you to create scenarios based on your data by making assumptions about KPI variations within a given scope (for example, +10% on the mobile conversion rate compared to last month). ✨
The result? Find the levers that will contribute the most to your goals! ✨
Comment l’utiliser : 🔧
- Cliquez sur + en haut à droite de votre bloc source. ➕
- Select What if and set up the dimensions, the scopes and KPIs in the left panel. 📂
- Click Apply then click compare block to instantly get your hypothesis output! ✅
📊 Turn your analytical ideas into actionable insights !

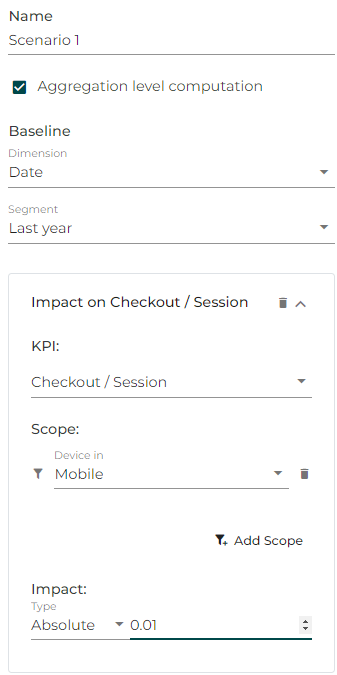
5.1. Baseline
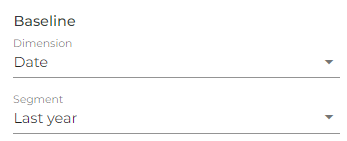
Define the baseline of your simulation, i.e. the part of your dataset that will be used as starting point.
In our example, since the simulation is based on “Last Year” data, the baseline will be defined as follows:
5.2. Impacted KPI(s)
Define the KPIs (within the metric relation) on which your taking assumptions in your simulation, on which scope, and the actual impact you want to size (absolute or relative)
- Relative:This approach allows you to simulate the impact of percentage-based changes on your KPIs. For instance, you can specify a 10% increase or decrease in a particular steps of your market equation. Relative variations adjust the KPI based on its existing value to explore effects on scaling changes proportionally.
- Absolute: In contrast, absolute variation involves specifying a fixed amount by which the KPI will change, regardless of its original value. For example, adding two dollars to your average price or reducing it. Absolute variations provide a straightforward way to simulate impacts of concrete changes that are not percentage-based.
In our example, we want an “absolute” increase of the Checkout/ Session to increase by +1pt (+0.01) on Mobile, so it’s an absolute change of +0.01 Note that we want the total average of Mobile users to increase by +1pt and not for each line of your dataset, so we keep the “aggregation level computation” activated
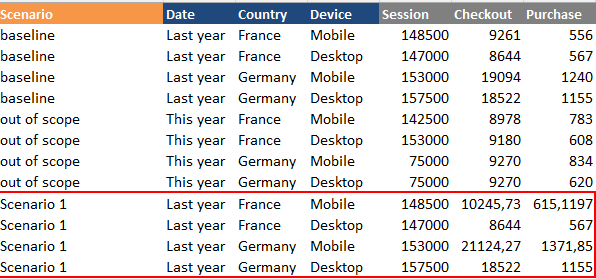
5.3. Results
Once applied your changes, Datama Prep will automatically create a new column “Scenario” with 3 values: your baseline, the scenario itself, and other data “out of scope” that was not in the baseline
In our example, this results in the following dataset
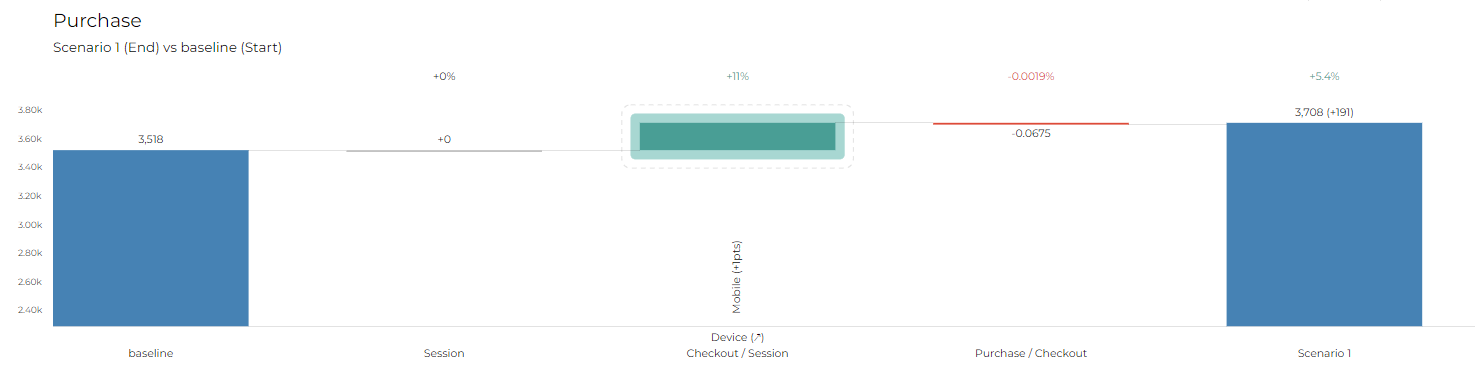
You will likely visualize your scenarios in Datama Compare, to size the impact of your simulations. Our example gives the following waterfall:
Congrats! Your dataset is ready to be uploaded in Datama’s solution!
To see how to save and share your dataflow, click here
6. Aggregate
The Aggregate block lets you aggregate the values of columns by the values of one or more keys, making it particularly useful for reducing the size of a dataset. It is the equivalent of Group by clause in SQL.
Let’s consider an example with the following dataset:

In the Keys section, you select all the columns that will serve as group keys. The output dataset will have the same number of rows as unique combinations of values in the group key columns. In the following example, “Device” and “Country” columns were group keys.
In the Aggregation section, you select all the aggregations. Basically: for each unique combination of values in the group key columns, what do you want to calculate? In the following example, this was the sum of “Session” and the mean of “Revenue” for each combination of group keys.
You can also remove some columns using the cross button (“Date” and “Transaction” in this example have been removed).

In our example, this results in the following dataset:

By default, some columns are in the Keys section and the others in the Aggregation section. It is possible to reorganize those sections, either by drag and dropping the columns at the place you want or by using the arrow buttons.
Finally, you can select the aggregation function to apply on each column in the drop down menu:

By default, the aggregation functions selected in the menu are sum for numeric columns and count for other types of columns.
Tip of the week 133: Optimize your data with the Datama Aggregation block! 🌟
Struggling with massive datasets? Want to reduce them without losing key insights? ✂️ Discover the Datama Aggregation block!
This tool in Datama Prep lets you group by one or more keys (dimensions) and apply aggregations like sum, mean, or max… to your metrics. ✨ The result? A lighter, more manageable dataset.
How to use it: 🔧
- Click + at the top right of your source block. ➕
- Select Aggregate and adjust the keys and aggregation settings in the left panel. 📂
- Click Apply to instantly get a condensed output table! ✅
📊 Streamline your data—your way!
