Prep - Add Source
Our tools allow you to enrich your local data with external data like Google Trend and others. Allowing you to understand all your kpi variation
Find here how you need to format your dataset for Datama solutions
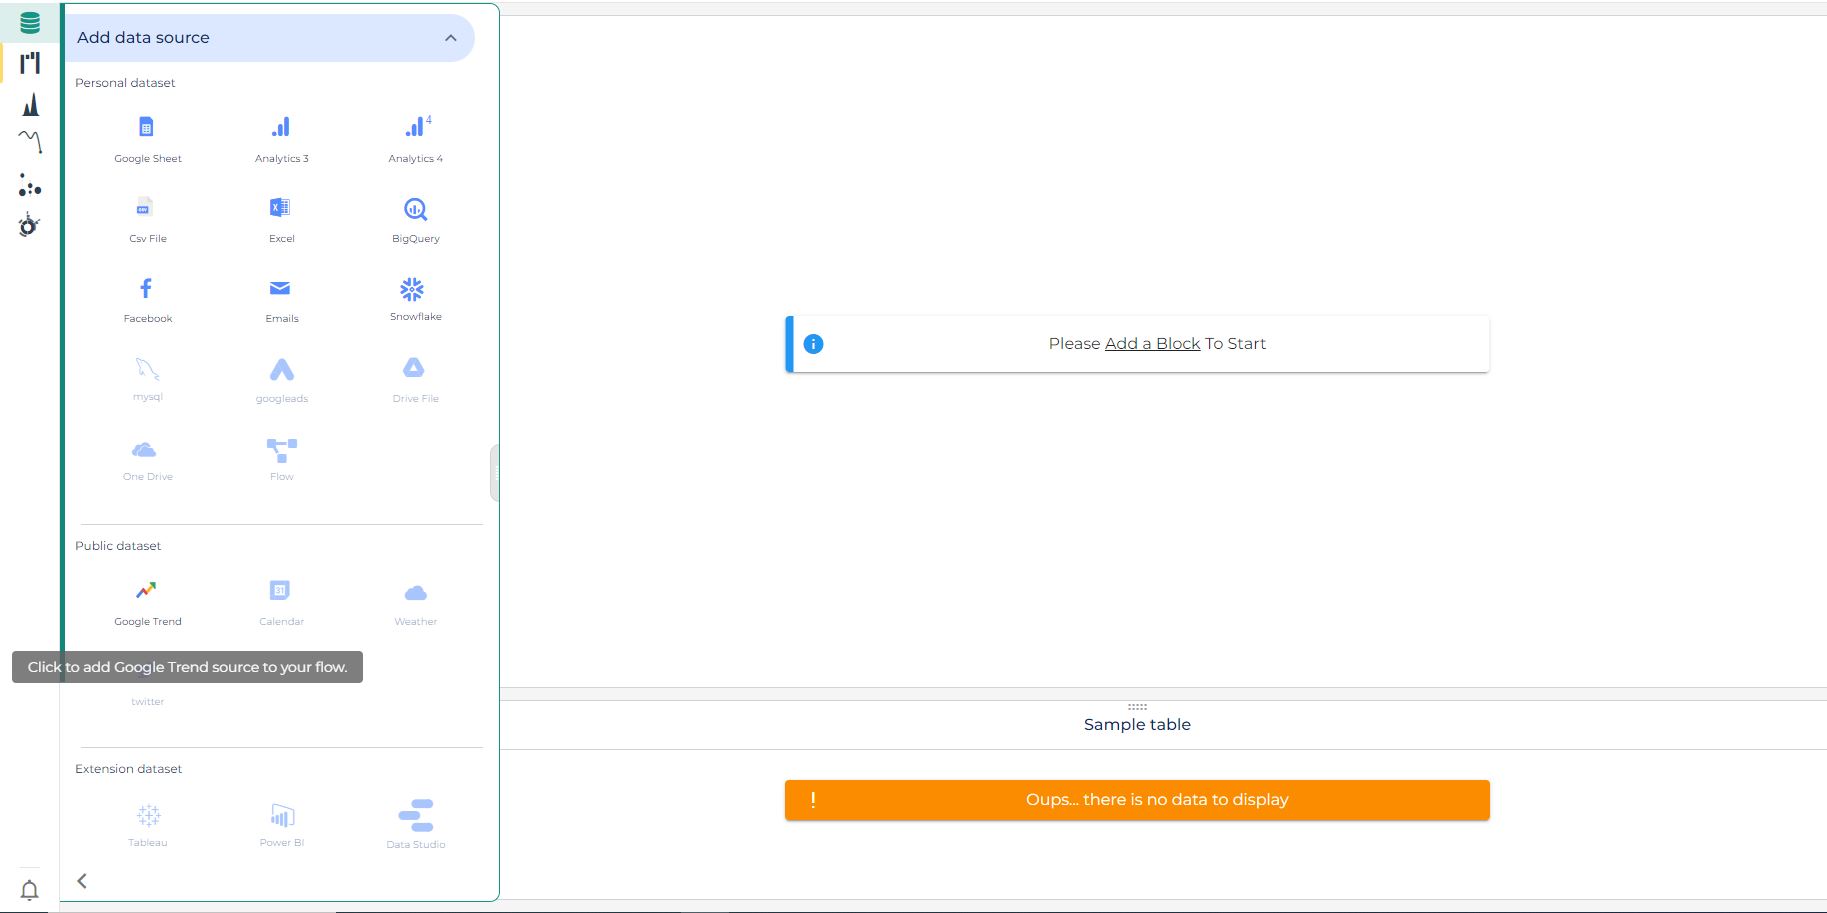
Here is the available connectors:

And see also our extensions (Tableau, Power BI, LookerStudio,…)
Google Sheet

When adding a google sheet block to your flow, it’ll require a small configuration.
- First you need to have the url of your google sheet. Copy/ past the URL or select it with the “Share” Button on the top right (next to your account name) inside google sheet and “Copy link”
- Share your Gsheet with Datama When your spreadsheet is public, you have nothing else to do. If you have a private spreadsheet we will need to have your authorization to access it. You can give access to your spreadsheet with the Connect or the Give access to Datama button on the connector. When those steps are completed, you just have to select the sheet you would like to load and click Load
Excel File

If you want to analyze your excel file, it’s easy. Click on the Excel connector, drop (or click) your excel file in the box given, and upload. You will be asked which sheet you want to use, and that’s it. Click on load and continue building your flow with more blocks.
Csv File

If you want to analyze your csv file, it’s easy. Click on the csv connector, drop your csv file in the box given, and upload. You will be asked which csv separator you want to use, and that’s it. Click on load and continue building your flow with more blocks.
Calendar


There are two possibilities. You either choose a suggested calendar from our team, or you can use one of your own. If you choose to use one of your own, you’ll need to have the url of your calendar, it can be a .ics, a public Google Calendar or an Outlook URL. Else you can the source URL we use printed (these calendars come directly from Google).

In case you want to use a private Google Calendar, you can use the secret link at iCal format from calendar parameters in Google Calendar interface. Now you simply have to click on Load
Google Analytics 4
You can pull your GA4 data in Datama Prep, using the GA4 API. Click on the Analytics 4 connector in Datama prep, you might need to give authorization to your google analytics by clicking on Connect button.
Select your property, metrics and dimensions. You can choose only one property and only 9 dimensions and up to 10 metrics. You can also filter data from Google Analytics 4, using the filter section
Timeframe selection Select whether you want a relative date, or absolute. If you want to lock your timeframe selection, uncheck the “move the time window overtime”
Avoid sampling
One thing to keep in mind: when pulling large datasets from Google Analytics 4 into Datama Prep, Google Analytics may sample your data before loading it into Datama. This auto-sampling can leave your data incomplete, making your final analysis less accurate.
That’s why Datama offers the Chunk Data option.
In short, this feature lets Google Analytics split your large dataset into smaller parts and import them in multiple calls. Based on what you know about your dataset, you can decide how many parts to split it into.
The interface looks like this:

However, this option may slow down the import process, as Google Analytics needs to run multiple queries.
Prorate metrics totals
As in any expore report of GA4, pulling certain metrics on certain dimensions might double count this metric. That is why you can use “Prorate metrics totals”. Datama will then pull the actual, unduplicated total metric value and prorate the split to match the total account. For instance, imagine a user sees 2 items in 1 session, and you pull Sessions by Items. Without activating this option, you would end up with the Sum of the sessions column being “2”, above the actual number of sessions that you have in total in GA4, being 1. By using the “Prorate metrics totals”, you will get 0.5 session for each item, and the total will match the overall 1. Note that when doing comparisons, you may want to pull data by separate periods, so that pro rata is done for each period separately, hence the variation between those two periods matches totals variations.
The column total may not be the actual total if a row is counted multiple times. Therefore, we use the actual total provided by the Google Analytics API in the query. We then prorate each value of the metric concerned between our calculated total and the actual total.

Tip of the week 152: Update on GA4 source filtering in Datama Prep
Great news for Datama Prep users working with a GA4 source: you can now build more advanced filters by combining “AND” and “OR” clauses, up to 3 levels deep 🤓 This makes it easier to extract the exact number of users or sessions who performed at least two different types of actions/events💡 Reminder 📝: the GA4 source is still subject to API limitations. Always make sure your chosen metrics and dimensions can be queried together (both in the data you retrieve and in the filters you apply).

Tip of the week 147: Get precise GA4 data: no more sampling
If you connect Google Analytics to Datama and work with large datasets, GA4 might sample your data — which can lead to inaccurate insights. Fortunately, the new “Avoid sampling” option in Datama Prep solves this! 💡 With one click, you can split your dataset into smaller chunks, so GA4 treats them as unsampled. You would get more accurate data, better decisions. 🎯 Try it now and see the difference in your analysis! 📊

Tip of the week 141: Datama Prep «multiple date ranges» available for GA4 and Piano sources!
🚀 New feature available in Datama Prep! It is now possible to define several date ranges in the same source block for GA4 and Piano connectors. 🎯
- This avoids the need to create several separate blocks (e.g. one for last year and another for this year) and then merge them.
- What’s more, you can add a «Date range» column to facilitate comparison, without having to use a date dimension. 🔥

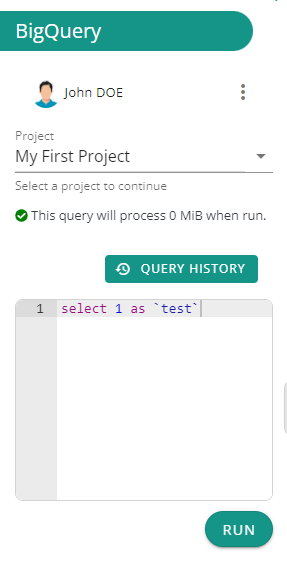
Google Google BigQuery
You can do an sql query on your Google BigQuery and use it in Datama PREP. When opening the BigQuery block you can see which Google account is connected and you can disconnect it if you want to use another one.
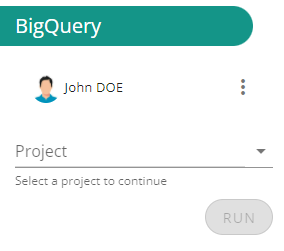
After selecting a project you are able to write a query in the project. You can also choose to reuse a query that you have already made before using the “query history” button. When you have typed your query it is checked to see if it is valid or not. It is then displayed the amount of data it will use in Google BigQuery.
Tip of the week 143: New source block in Prep: Table Connect
You can now link Datama directly to a full table in Prep—no need to write a specific SQL query. Just connect your table in BigQuery, Snowflake, or Redshift, and handle all your filtering, comparisons, and clustering directly in Datama with our NoCode feature.
⚡Datama pulls only the data you need, auto-aggregates dimensions, and keeps things light and fast—so you can focus on insights.
🗒️Please note that after a table connect block, data refinement blocks cannot be used for the moment (e.g. “Clean”, “Aggregate” …).
Smarter connections, faster insights. Try it out! 💡

The mail allows you to gather data from your email reports. Some ads providers send daily reports of multiple tracked KPIs. Usually, those reports are attached to a scheduled mail in your inbox. Now you can download those dataset into Datama and have a scheduled analysis.
Instead of using your inbox to send the reports, Datama will generate one for you. Select Datama email generated in the first selector, this will generate a unique email address to use when making your scheduled reports. Copy this email address and when you are building your scheduled reports on your ads provider, use this email.
In order for us to know which mails we are getting data from, you will be required to put the ads provider’s email in the email sender (who is sending the report usually something like noreply@acme.io ) OR an email subject (like “Your scheduled report by Acme, Inc”)
You can fill both or one of the inputs to filter out mails.
The “Data Location” section tells us where we should scrap the data from. If the data is stored in attachment, then you can set up in the advanced settings parameters like the separator, number of lines to skip etc…
If the data is stored on a remote server, try to check on your emails to see something constant in your reports url (where we should download the report from). For ex. if your reports are always downloaded through Amazon’s server, urls will always contain ‘amazonaws.com’ since it’s the part that doesn’t change in the report url. So you can use this in the field below
Snowflake
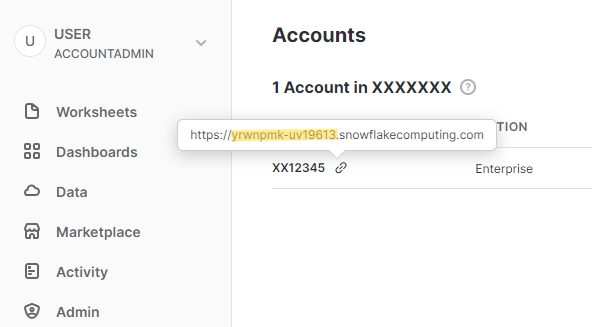
When using the snowflake connector, you’ll need the following information to configure the Snowflake source :
- Organization link which is the link https://XXX-XXX.snowflakecomputing.com
- In this link you’ll need the Account ID which is XXX-XXX part of the url.
- You can find it by going in your Snowflake Admin > Accounts.
- Hover the account you would like to connect to, and a link icon should appear next to account name, copy the url.
- Cut the Account ID from the url.
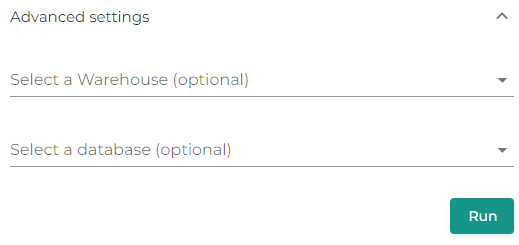
- Warehouse (optional)
- Database (optional)
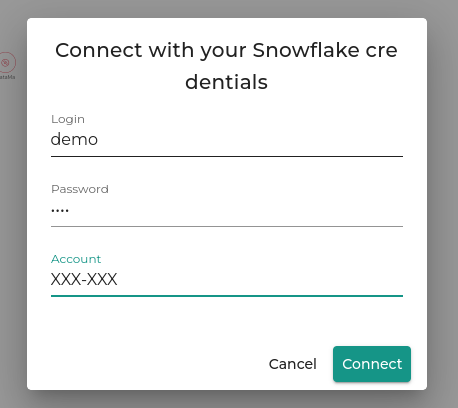
With those information, you will need to fill your credentials and the Account ID in the account field. Once finished, hit connect.
When connected, you can select a warehouse and a database in advanced settings if needed, and input your query.
Google Trends
Google Trend is most of the time a dataset that needs to be appended with another dataset.
With Google Trend connector, you can enrich your data flow with Google Search result in a given date range
You can cross your data with Google trends data
Choose the period of time you want to focus on, the country concerned by this trend and at last step enter your keywords.
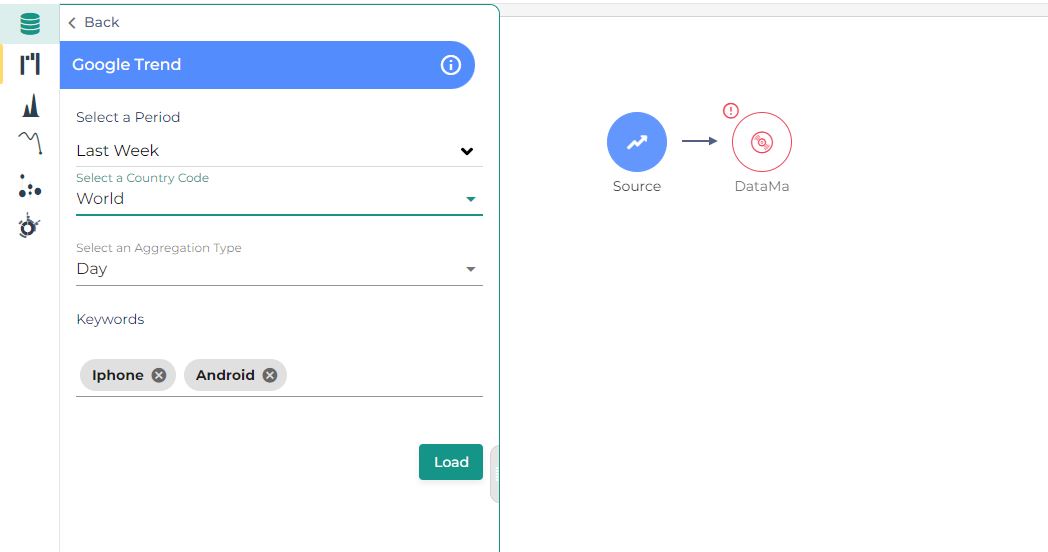
It will enrich your analysis by comparing your own data of your e-commerce website or marketing campaign results with the data and trends of the market. You will be able to compare your evolution with a larger point of view and understand your performance in a more global context.
To understand better the tool “Append”, click here
You can upload your Facebook Analytics datasets in Datama PREP.
When opening the Facebook block you can see which account is connected and you can disconnect it if you want to use another one.
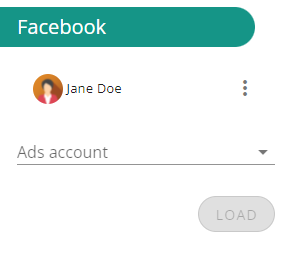
After selecting an AdAccount you are able to create a report by selecting fields, breakdowns, metrics and a preiod.
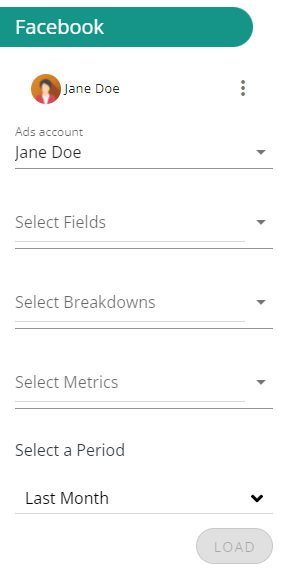
Since reporting is by default at the level of Adsets, it is not mandatory to select fields or breakdowns.
If no field or breakdown is selected the chosen metrics will then be applied to the Adsets available for the selected AdAccount.
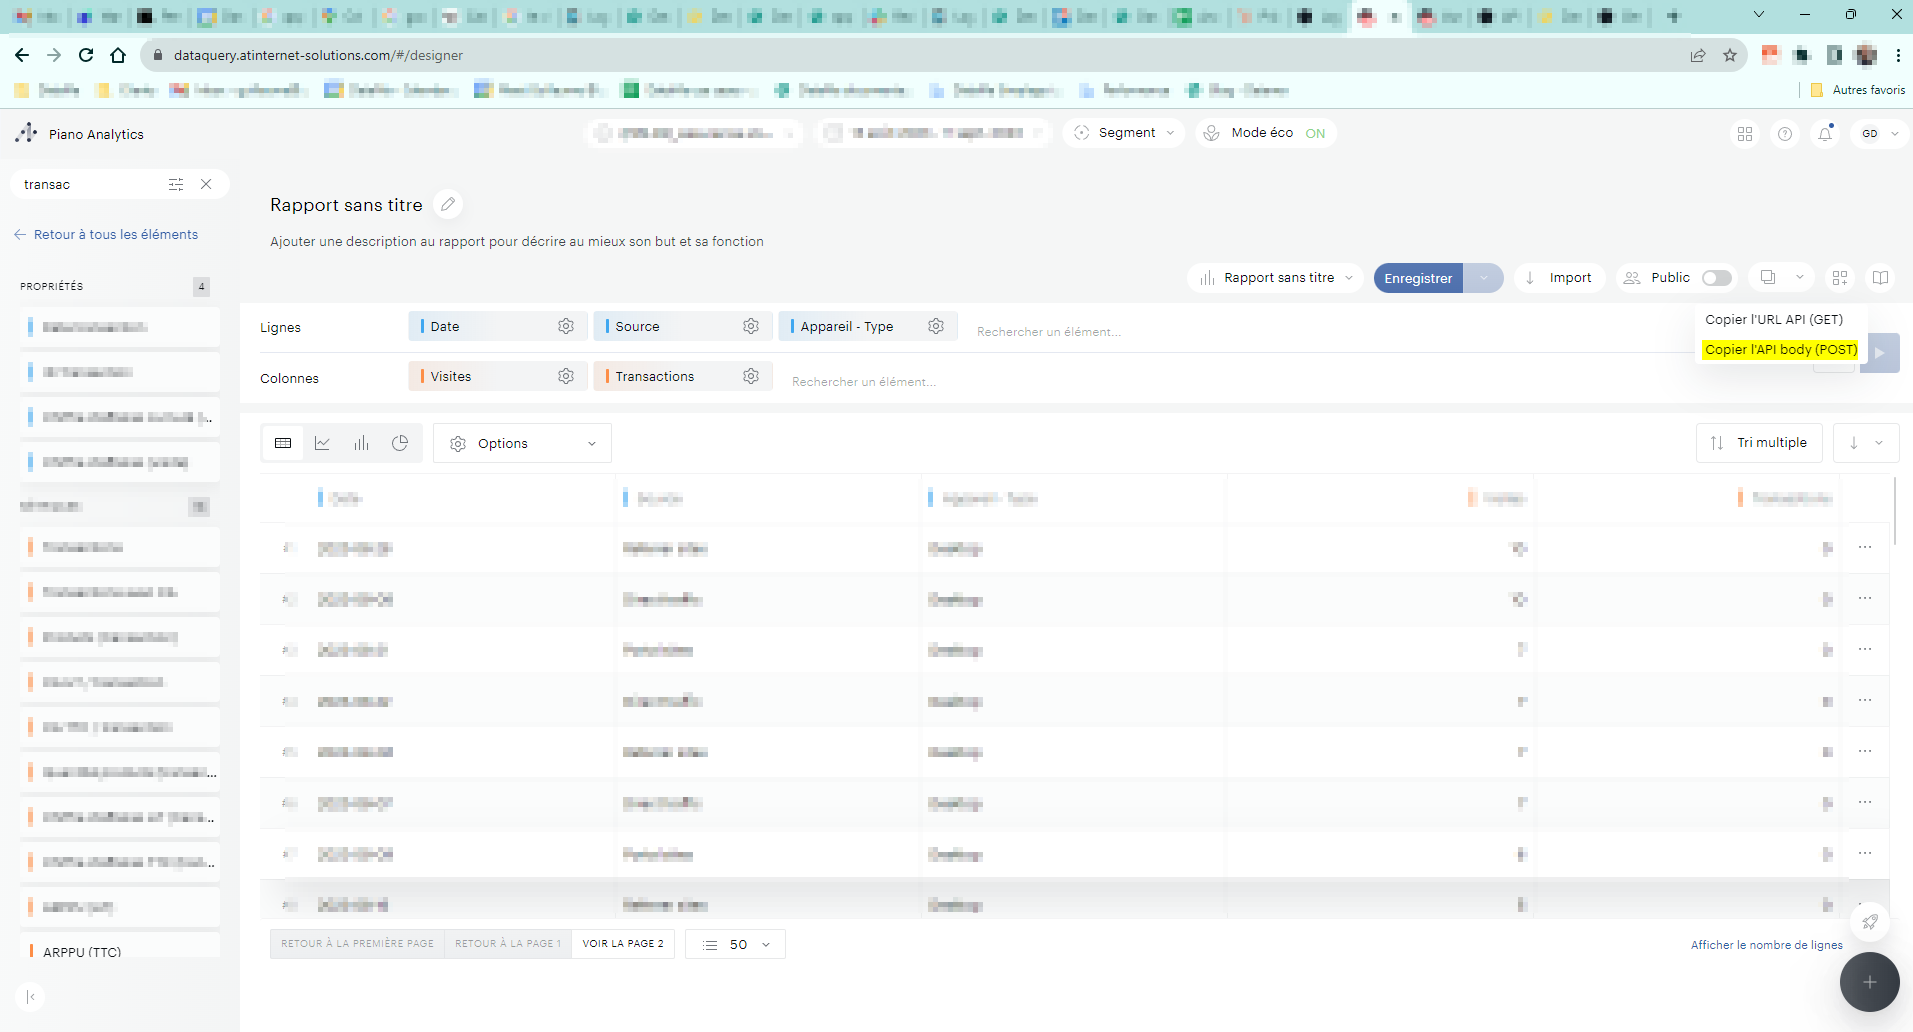
Piano Analytics
You can import data from the data query explorer of Piano (ex AT-Internet) in Datama
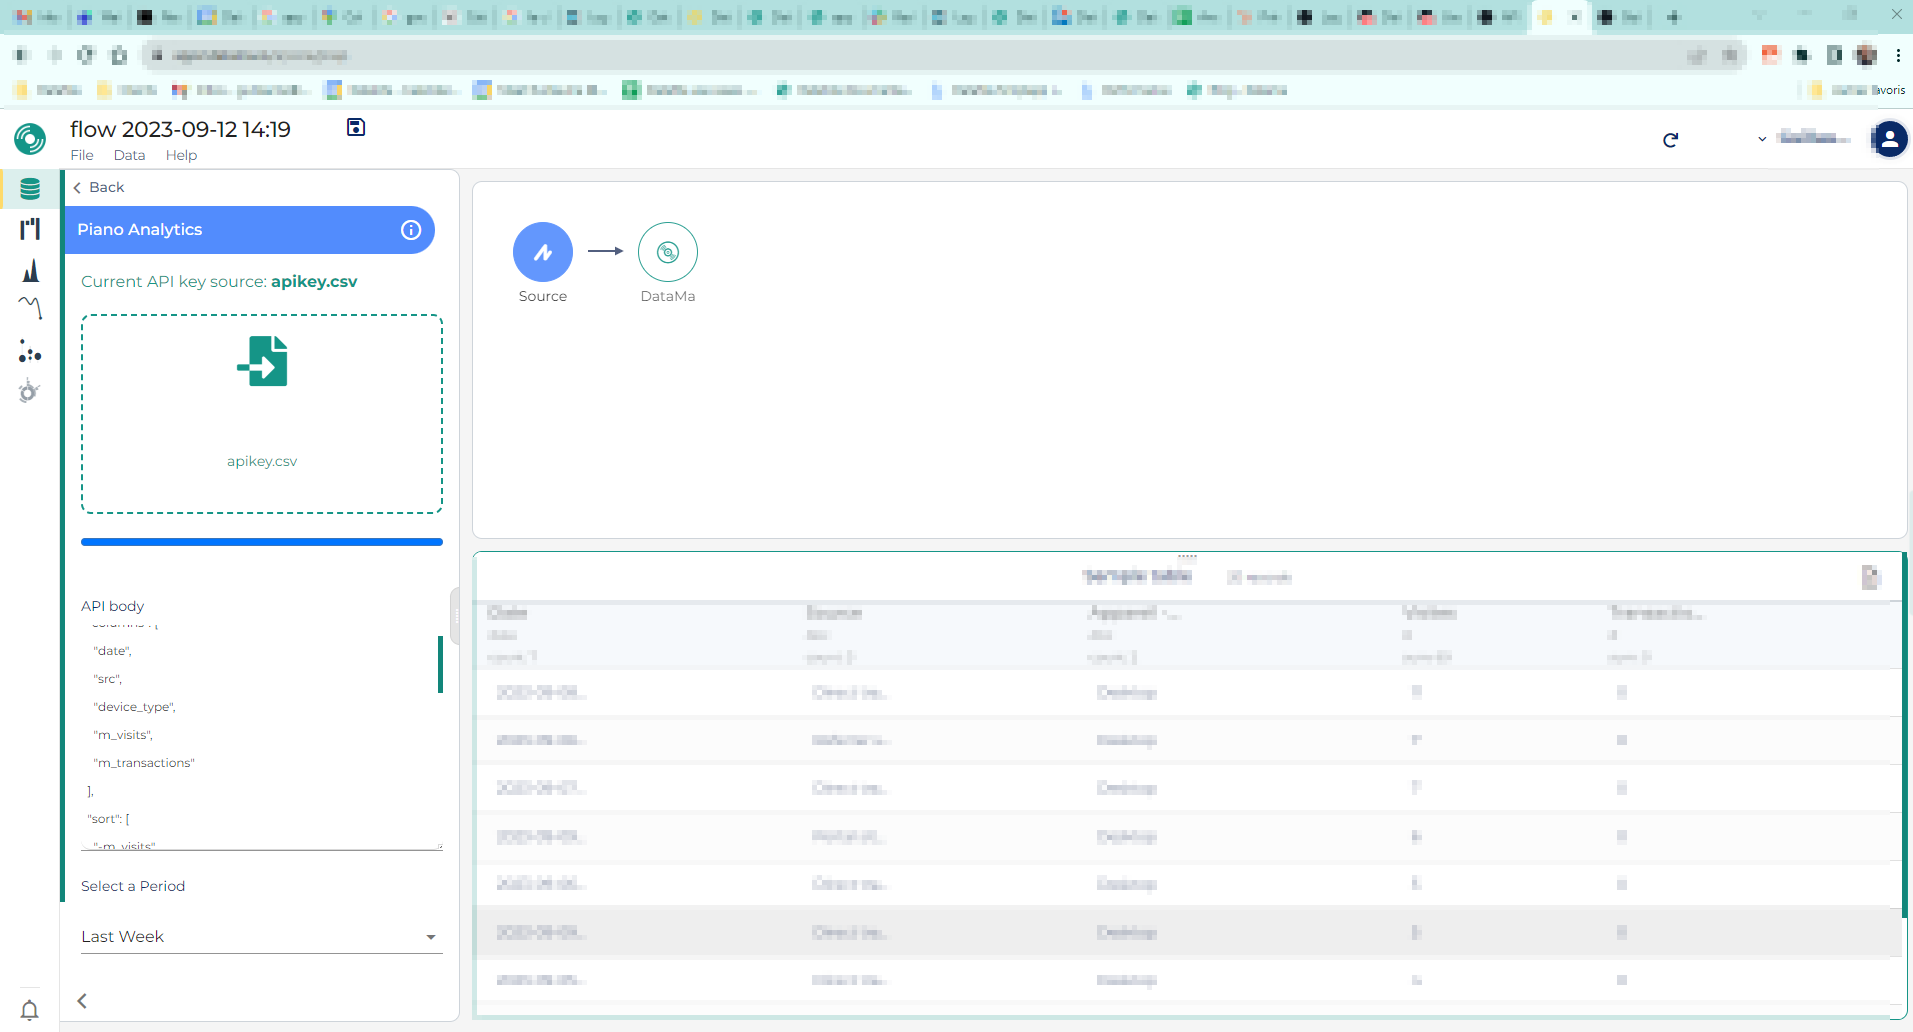
When opening the Piano Analytics block in Datama prep, you first need to upload an API key. This API key can be generated on your profile section in Piano learn more. Download the API key (.csv) from Piano on your computer, then upload it in Datama Prep in the API key section
Once done, you then need to paste an “API body” content. This will be generated in the data query interface of Piano Analytics: create a report containing the properties and metrics that you want in Datama and then hit “Copy API body (POST)” on the top right of the report and then copy the Body block
Then Paste the API body in Datama prep in the appropriate field
Lastly, define your dates for the report in Datama Prep (this will overwrite the dates you have set in the data query explorer interface in Piano, so that your data is always up to date)
Amazon Redshift
When using the Amazon Redshift connector, you’ll need the following information to configure the source :
- Host (ex. redshift-cluster-1.abc123xyz.us-west-2.redshift.amazonaws.com)
- Port (ex. 5439)
- Database (ex. mydatabase)
- Username (ex. myuser)
- Password (ex. mypassword)
With those information, you will need to fill your credentials in the Connector to log into your Redshift. Once finished, hit Login.

When connected, you can enter your query and click Load to apply it.

AI Dataset Generation
The AI-Generated Dataset is now available as a standard source block in Datama Prep. With this feature, you can generate a synthetic dataset simply by providing a prompt — the system will return a complete dataset along with an associated market equation. This capability is particularly useful when you want to quickly prototype a use case, or prepare a demo for stakeholders (internal or external), without needing to supply real data upfront.
Click on the ✨ block to open the chat window.

Explain what use case you want to build with a brief message or a screenshot. After a few seconds, you will receive a proposition of dataset and its corresponding market equation.

If you are satisfied by the equation, clic on ‘Generate CSV’ and your use case will be ready to use.
Metabase
You can run a SQL query on your Metabase database and use the result in Datama Prep.
When using the Metabase connector, you first need to connect your Metabase instance. Click on the Metabase block, then on Connect if no credentials are set. Enter your Metabase Server URL (e.g. https://your-instance.metabaseapp.com) and your API Key. You can generate an API key in Metabase from Admin settings > Authentication > API Keys. Once filled, hit Connect.

When connected, select a database from the dropdown and write your native SQL query in the editor. Rather than writing a query from scratch, best practice is to copy paste the SQL query generated for your question directly in Metabase interface (Question > Edit Question > See SQL)

When your query is ready, click Run & apply to execute it and load the result into your flow. The sample will update with the data returned by Metabase.
