Dataset
This section identify the type of data you should load in Datama Prep
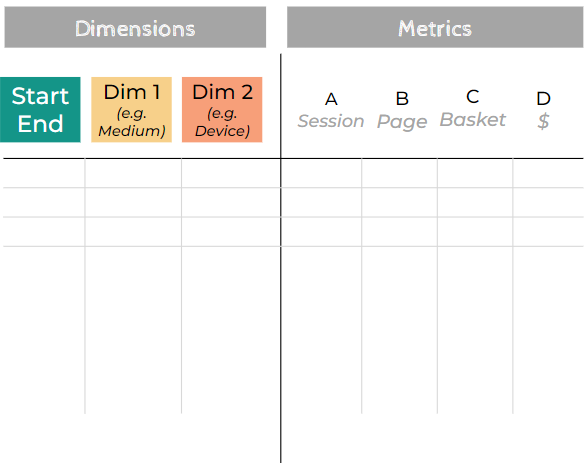
Datama source is basically a flat table. As in other well known analytics software (e.g. Tableau), we differentiate Metrics and Dimensions. Think Metrics & Dimensions as columns of a datasource.
For now Datama has a limit of 300 000 rows per analysis
Datama demo has a series of saved versions using different sources that you can get inspired from looking at this Google Sheet.
As for example:
1. Order of columns
Start your dataset by Dimensions and then metrics. The Dimensions should start by the comparison dimension (see details below) followed by all the explanatories dimensions. The metrics should end with your main KPI and preceded by all the sub performance indicator that are linked to your KPI.
2. Metrics
Metrics are always numeric values.
As an input, you need to put only metrics that can be aggregated (i.e. summed). To simplify, this basically means that it has a business sense to sum this Metric. Eg. « Revenues » is something you can sum. However, a ratio like « Revenues/ Purchase » is something that doesn’t have much business sense to sum (Datama will do ratios for you)
To decide which metrics you want in your source, everything depends on your use case. However, it’s safe to say that you want at least the metrics that you need to compute the KPI you want to explain. Then you would need all the metrics that are required to compute your « market equation ». Please report to Metric Relation section for more details.
For more information, you can also read our article about metric relation.
3. Dimensions
Dimensions can be either dates, characters, or even numeric values.
To decide which dimensions you want in your source, you may want to think about which dimension has an impact on your business, but also which dimension you’re able to collect, and cross your metrics on. At any rate, you certainly want to have one dimension that is the dimension you want to compare on. E.g. if you want to compare two periods, you want a ‘Period’ dimension. If you want to compare two business units, you certainly want a ‘BU’ dimension.
If a dimension is continuous (i.e. numeric) and has more than 6 possible values, it will get discrete by a partition algorithm, in order to be able to compute mix effects & performance.
Number of dimension are theoretically unlimited. However, as your dataset get bigger and bigger when you add new dimensions, you may want to limit yourself to a set of 3 to 8 dimensions, just for performance reasons.
🛈 Info : In order to define and configure your metrics relations you need to first configure your flow (using a variety of sources and action blocks) and then click on the Datama block there you will be able to define Metrics and relations