Detailed View
This chapter is stil in construction in the solution (see old version of Datama to get information about the Detailed View)

Detailed View is a group of 4 tabs. See the articles below for details on each tab:
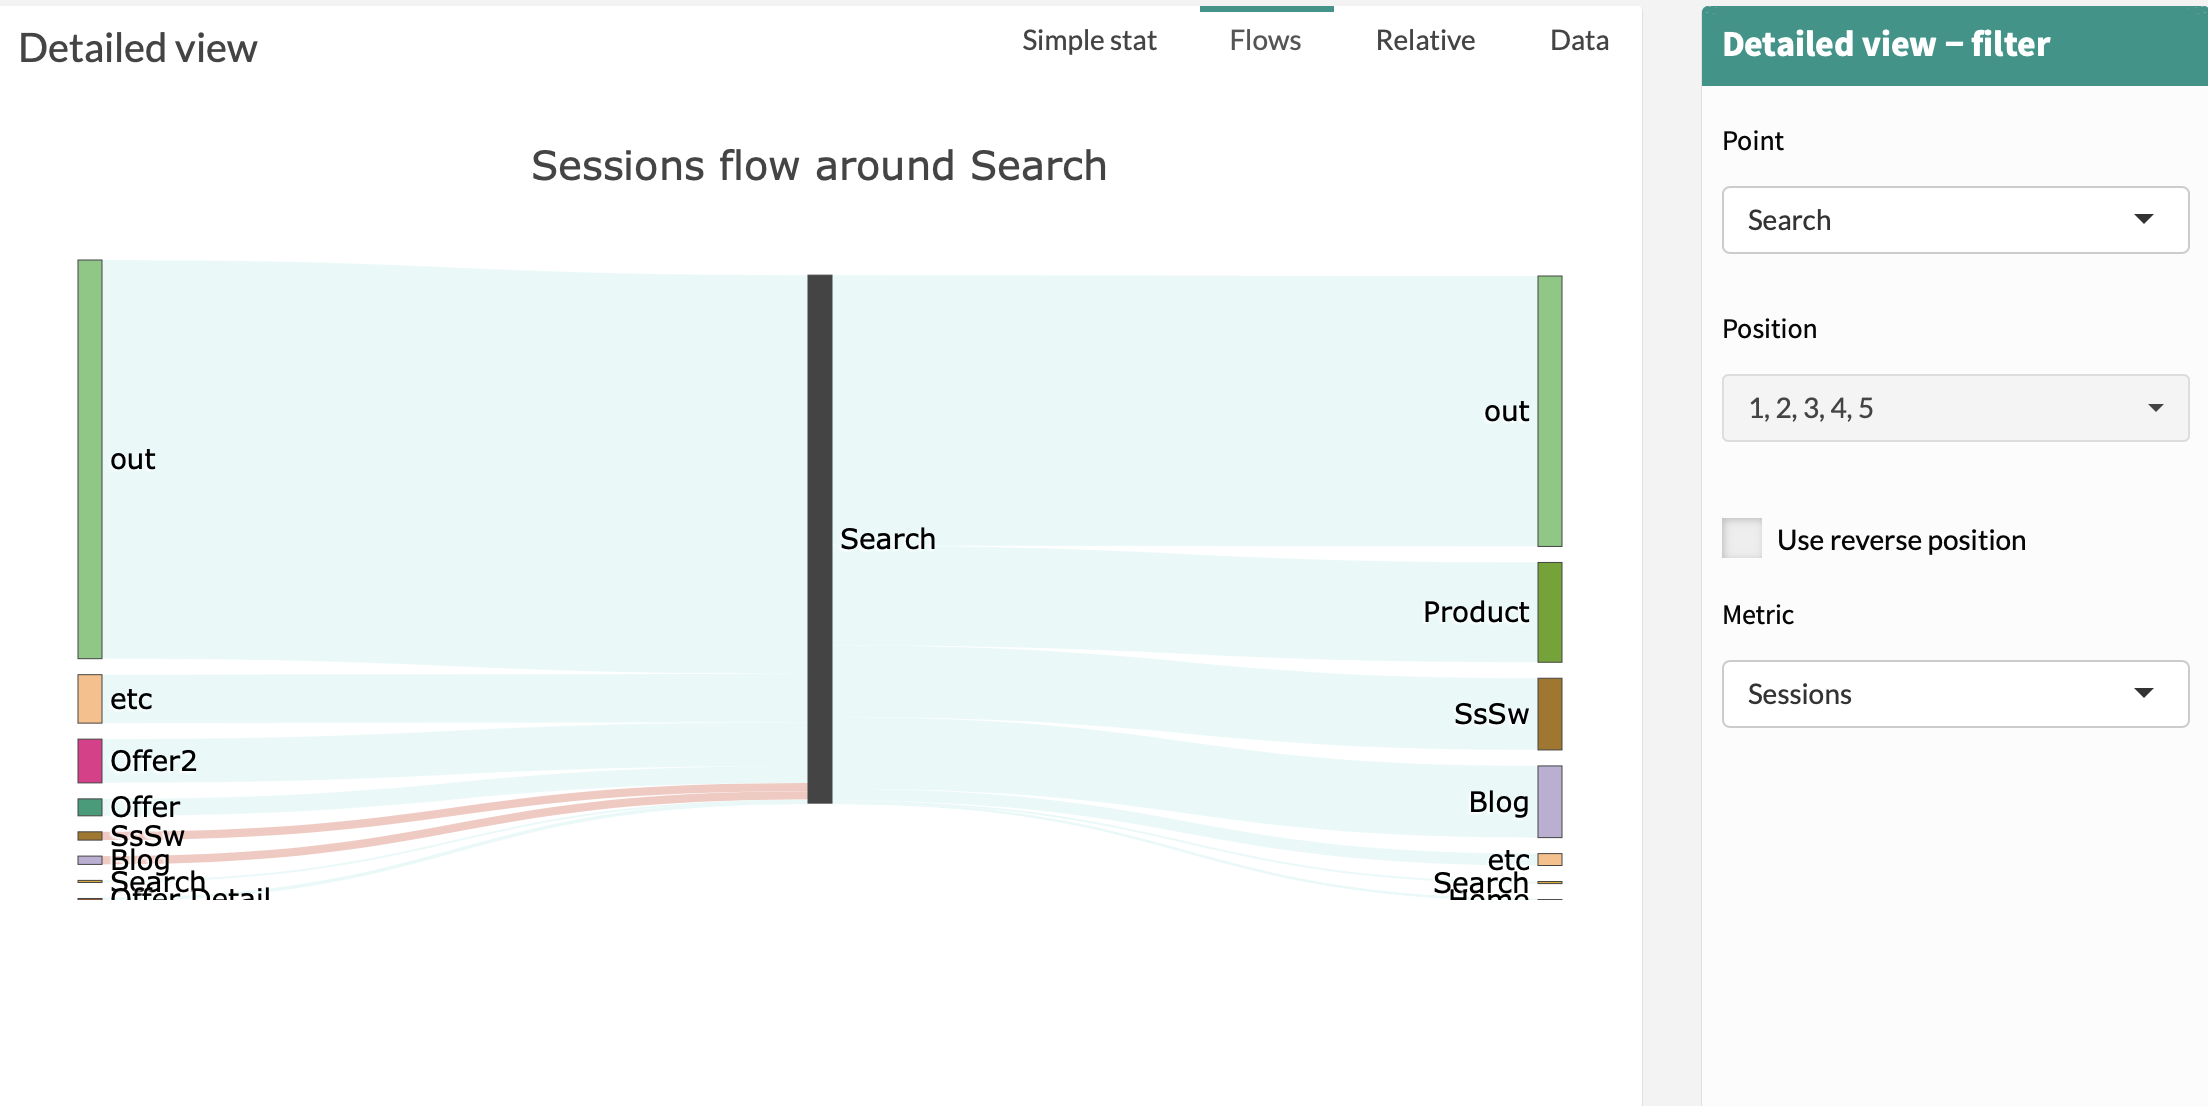
1. Flow
The Flow tab is a graph allowing you to visualize previous points and next points for a chosen touch point (Point in Detailed View Filter) on a choosen metric (Metric in Detailed View Filter).
If Compare Mode is activated, then then End Dimension will be represented. Green represents positive variation between Start and End, while red represents negative variation between Start and End.
The size of the flow shown is related to the percentage of the metric flowing from one touch point to the other, in sequential order.
Example:
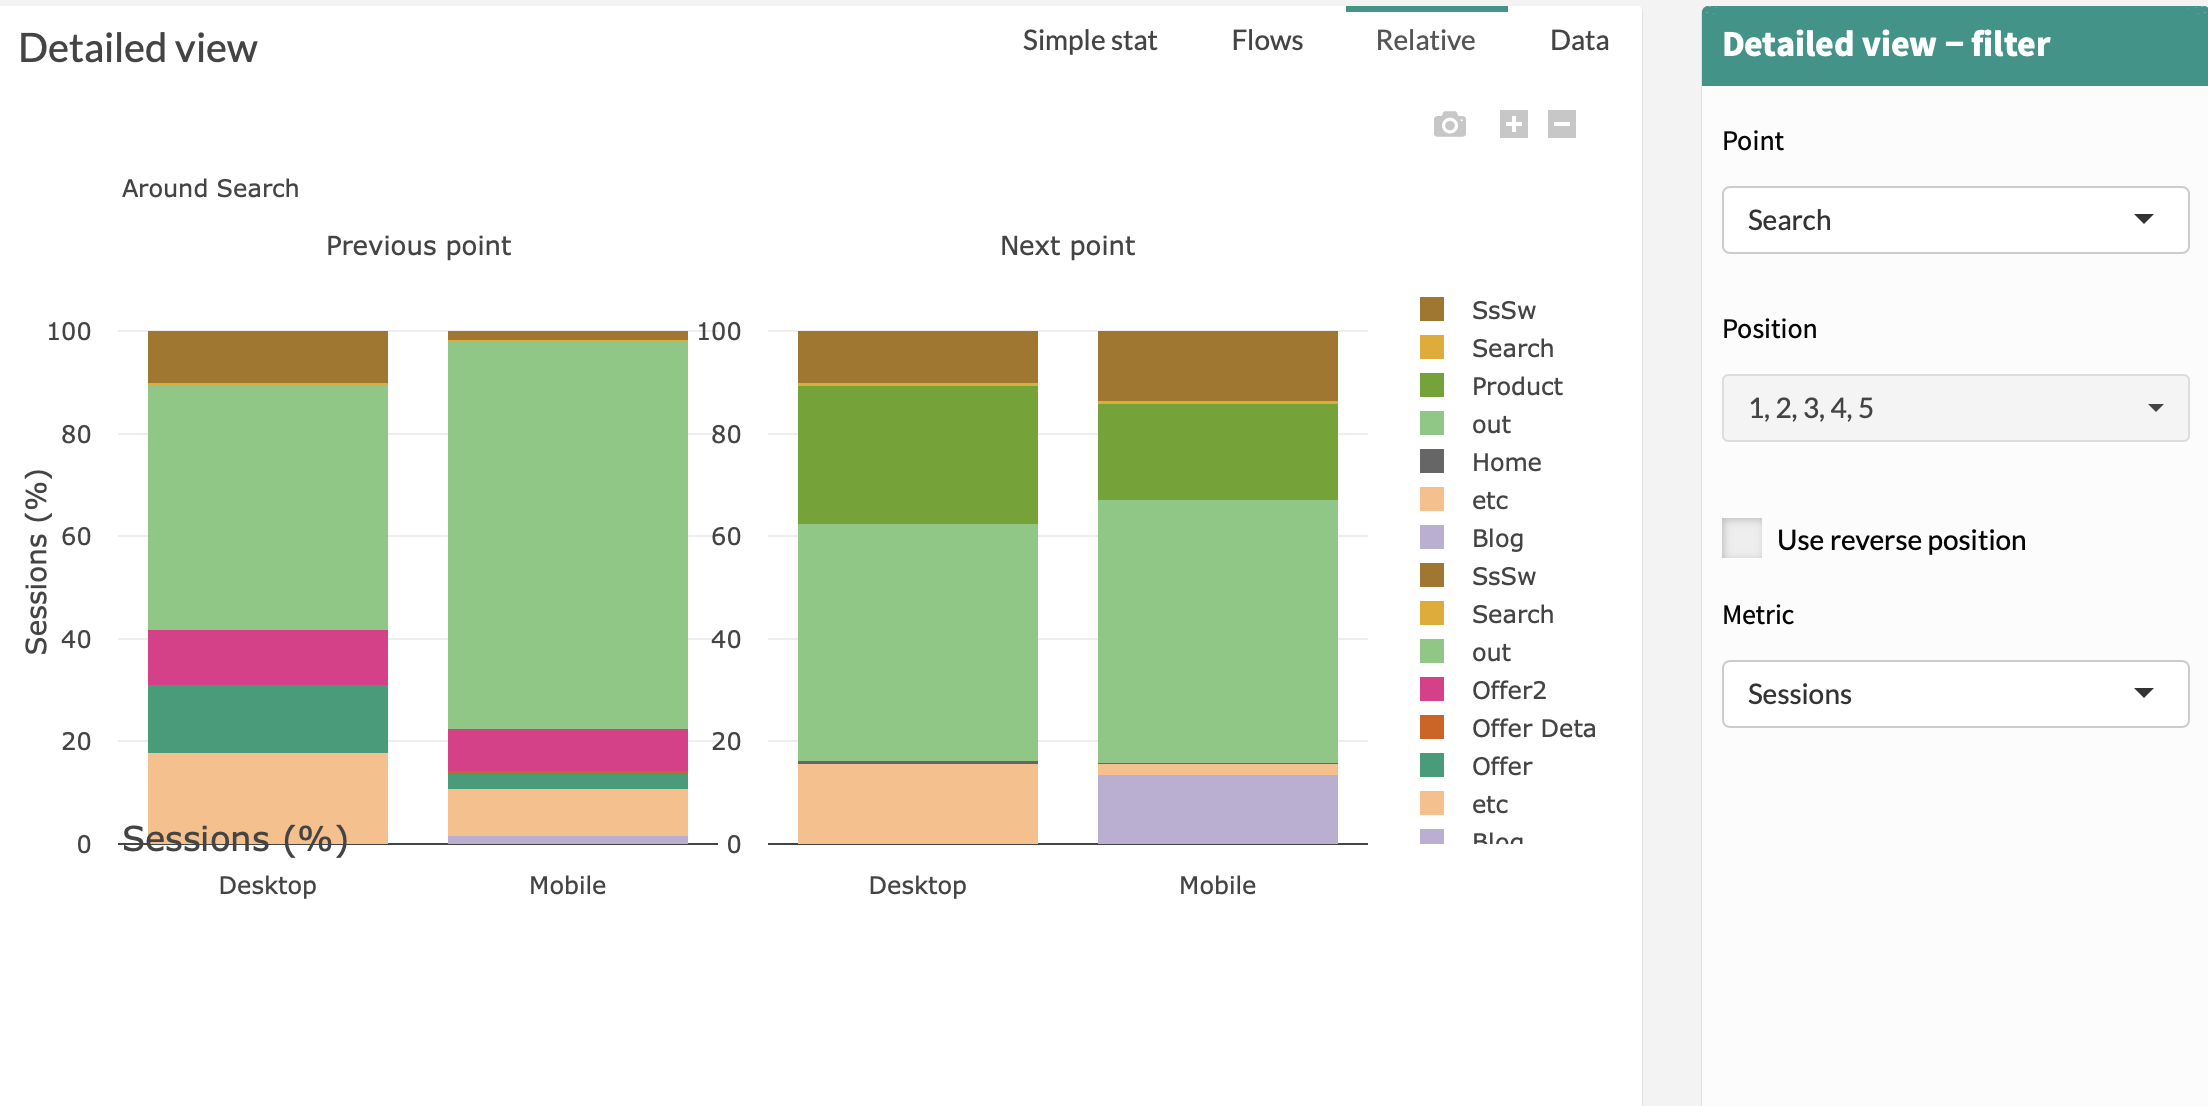
2. Relative
Relative is another way to display the Flow graph.
Example:
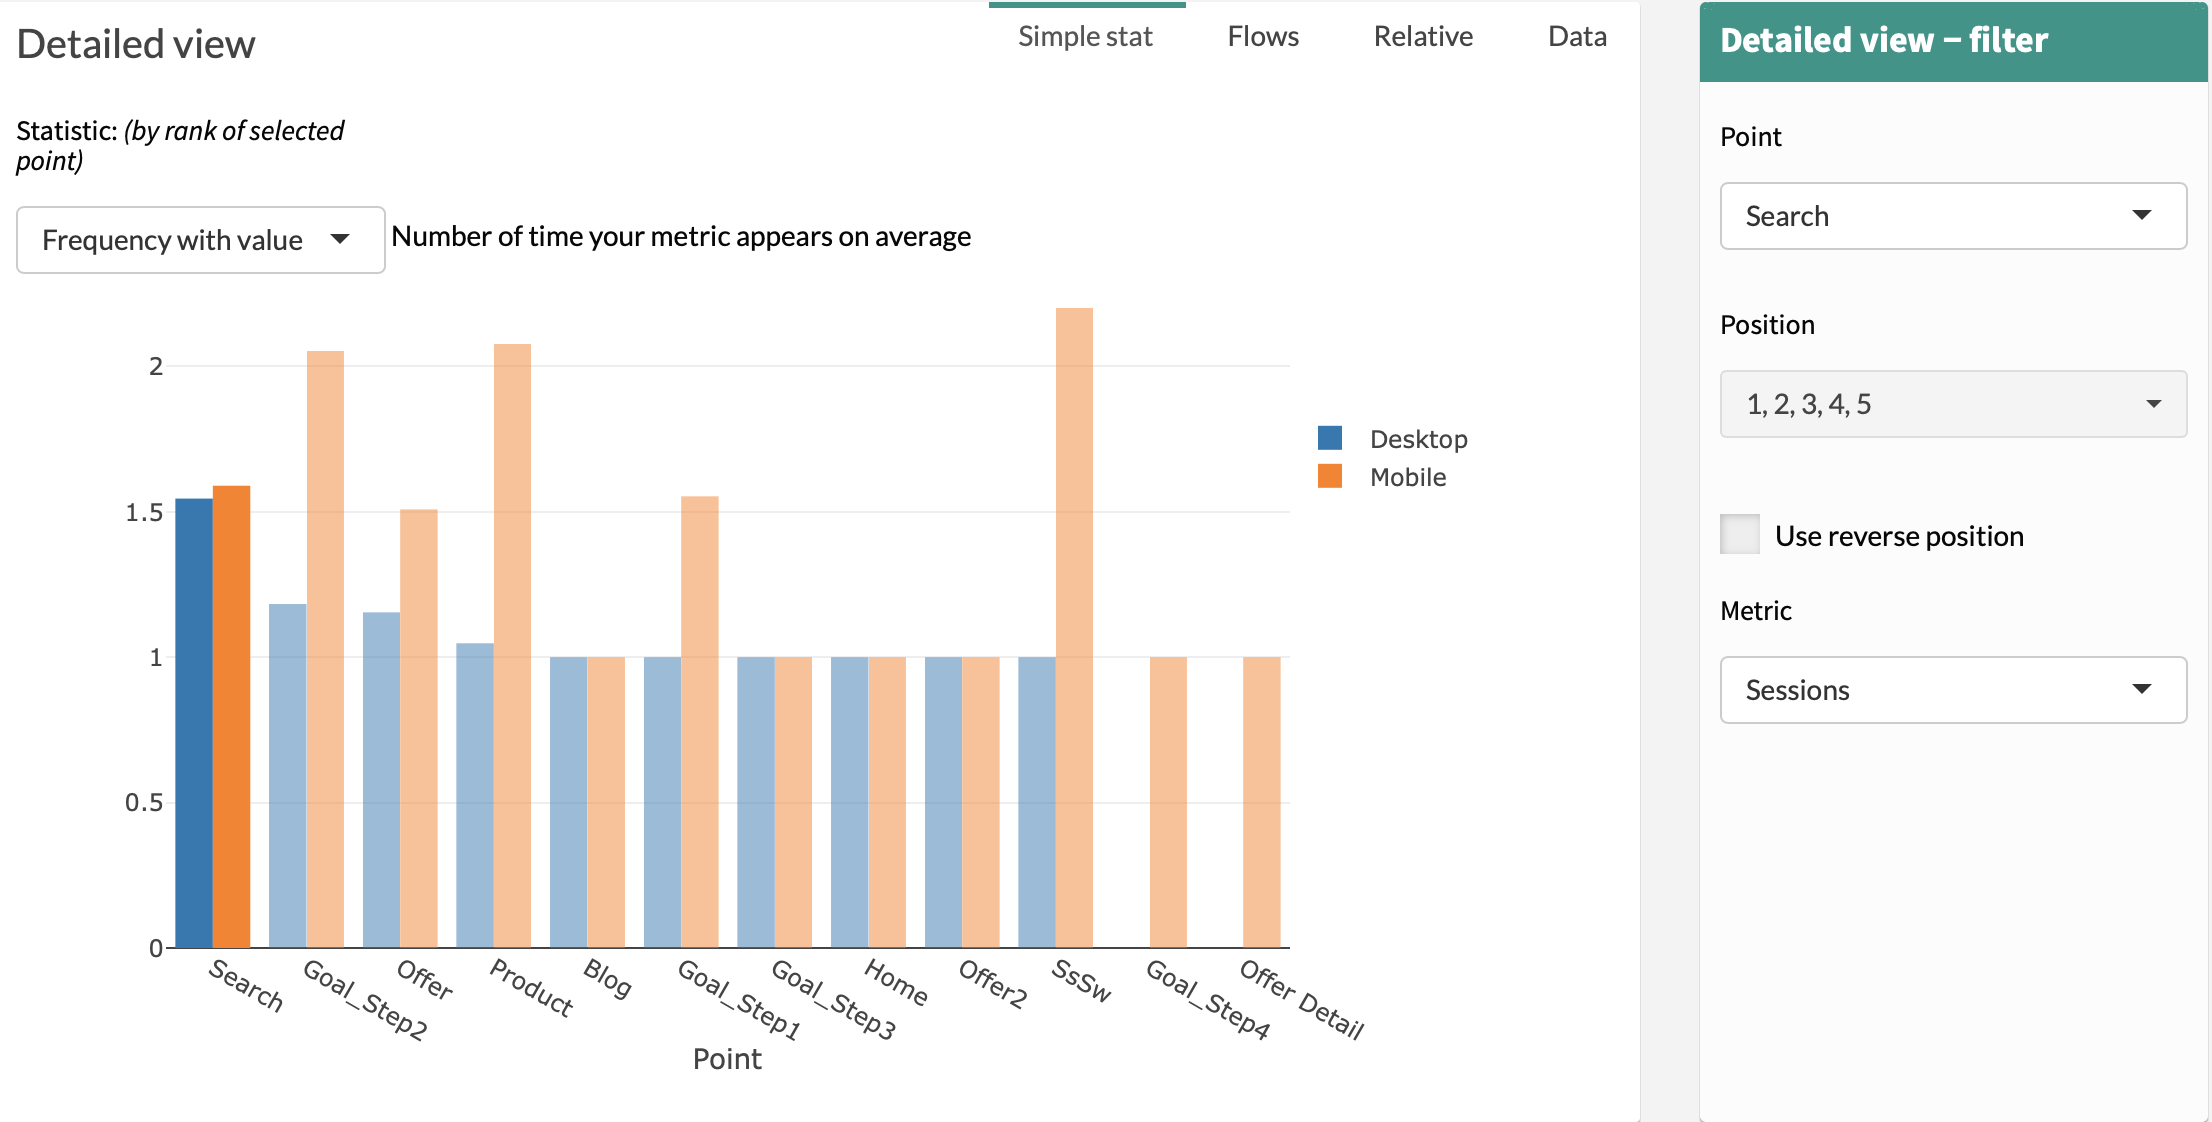
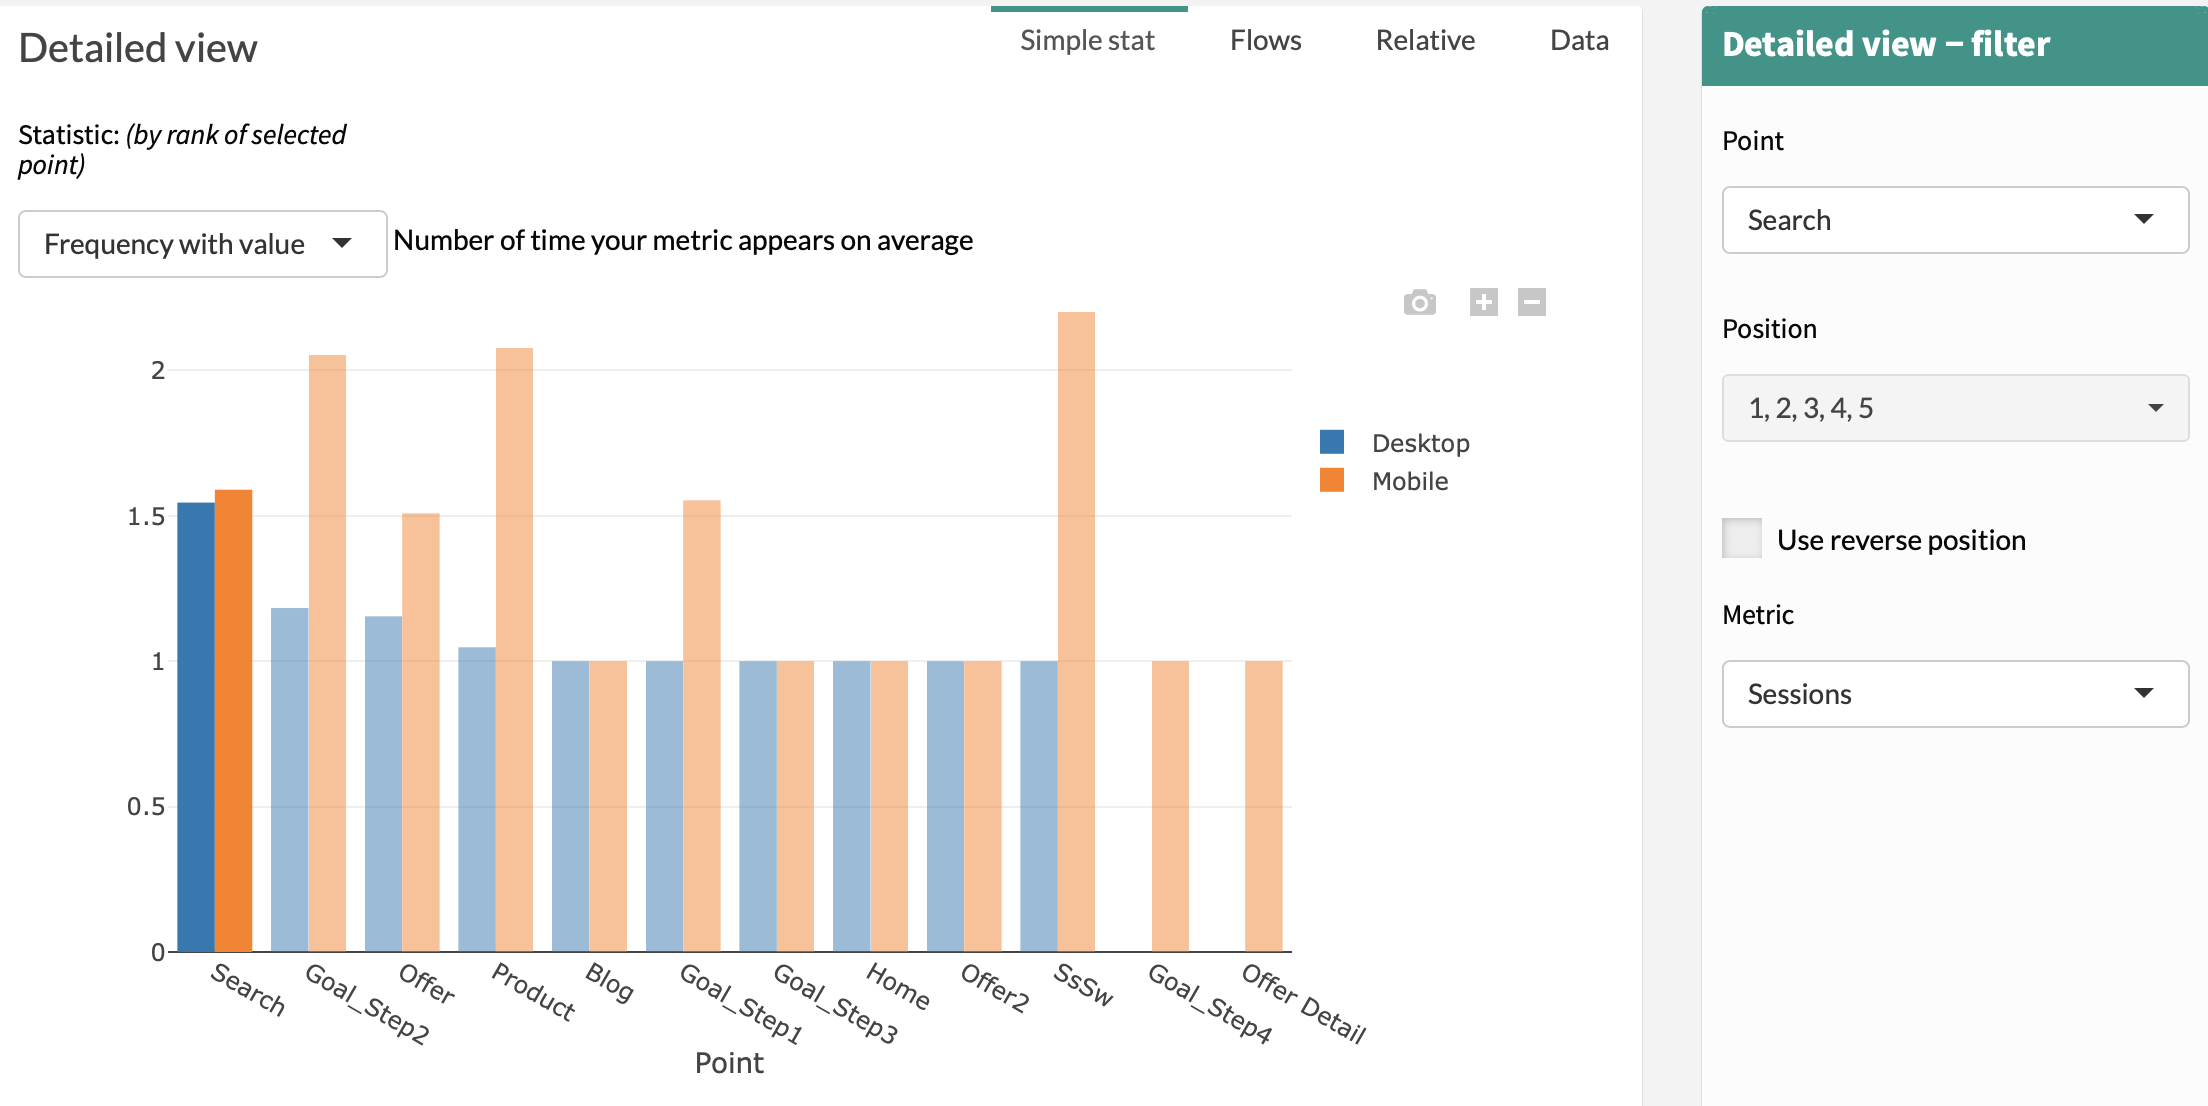
3. Simple Stat
The Simple Stat tab is a graph allowing you to visualize various information on the steps of your customer journeys:
- Frequency: number of time your metric appears on average.
- Appearance: presence probability of your metric in journey.
- Length: Average journey length when your metric appears
Example:
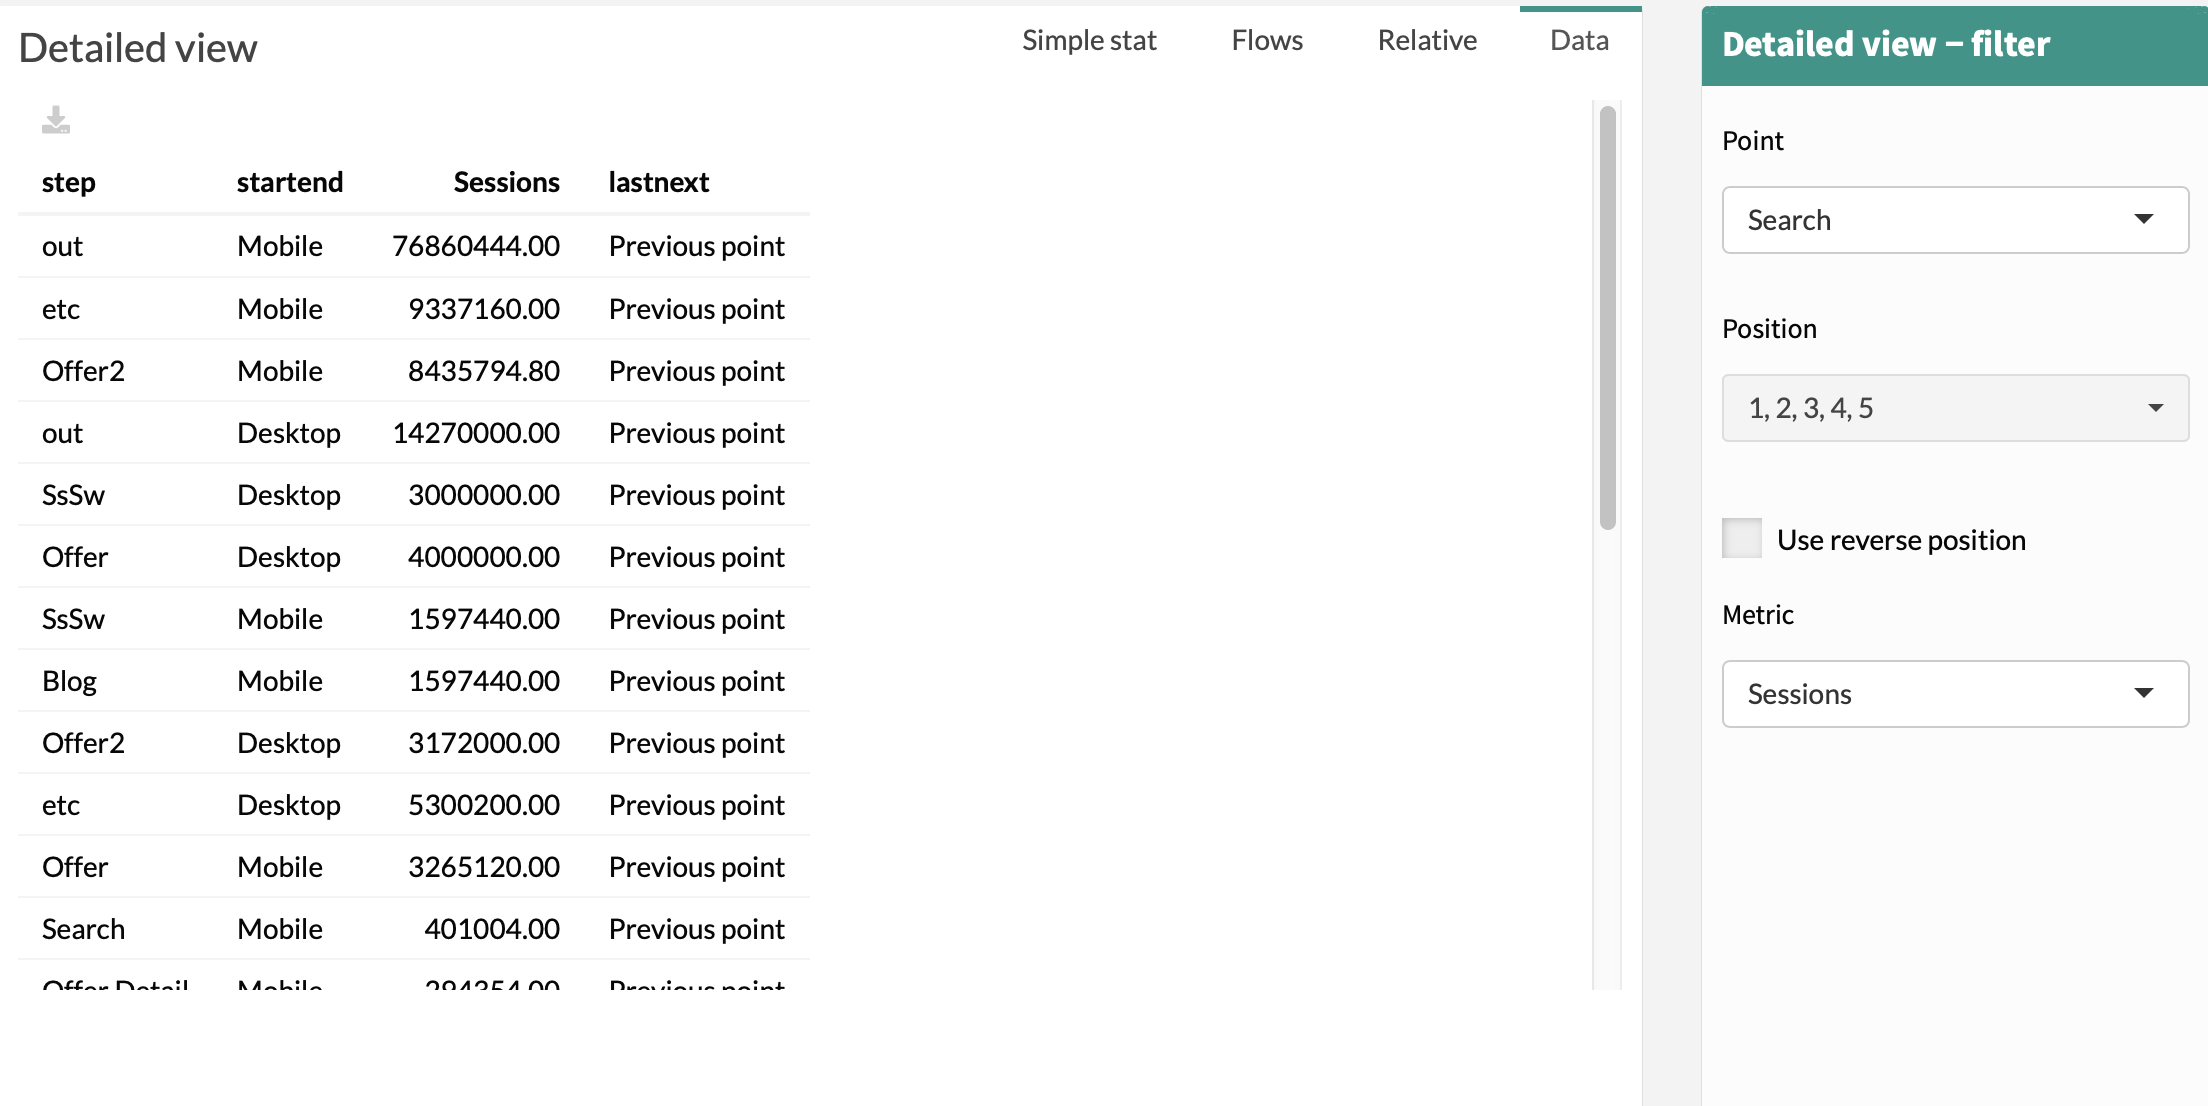
4. Data
The Data Tab is the table used to generate the other tabs of Detailed View.
With :
- step: name of the steps of customer journeys
- startend: start and end dimensions (selected in the menu)
- Volume: value of “Volume” (selected in the menu)
- lastnext: information used to create Flow