Detect - interface
Datama Detect aims at evaluating over time the normality of a variation.
Interface of Datama Detect:
- Header (find here general information about the Header)
- Subheader (find here general information about the Subheader)
- 1st Slide
- 2nd Slide
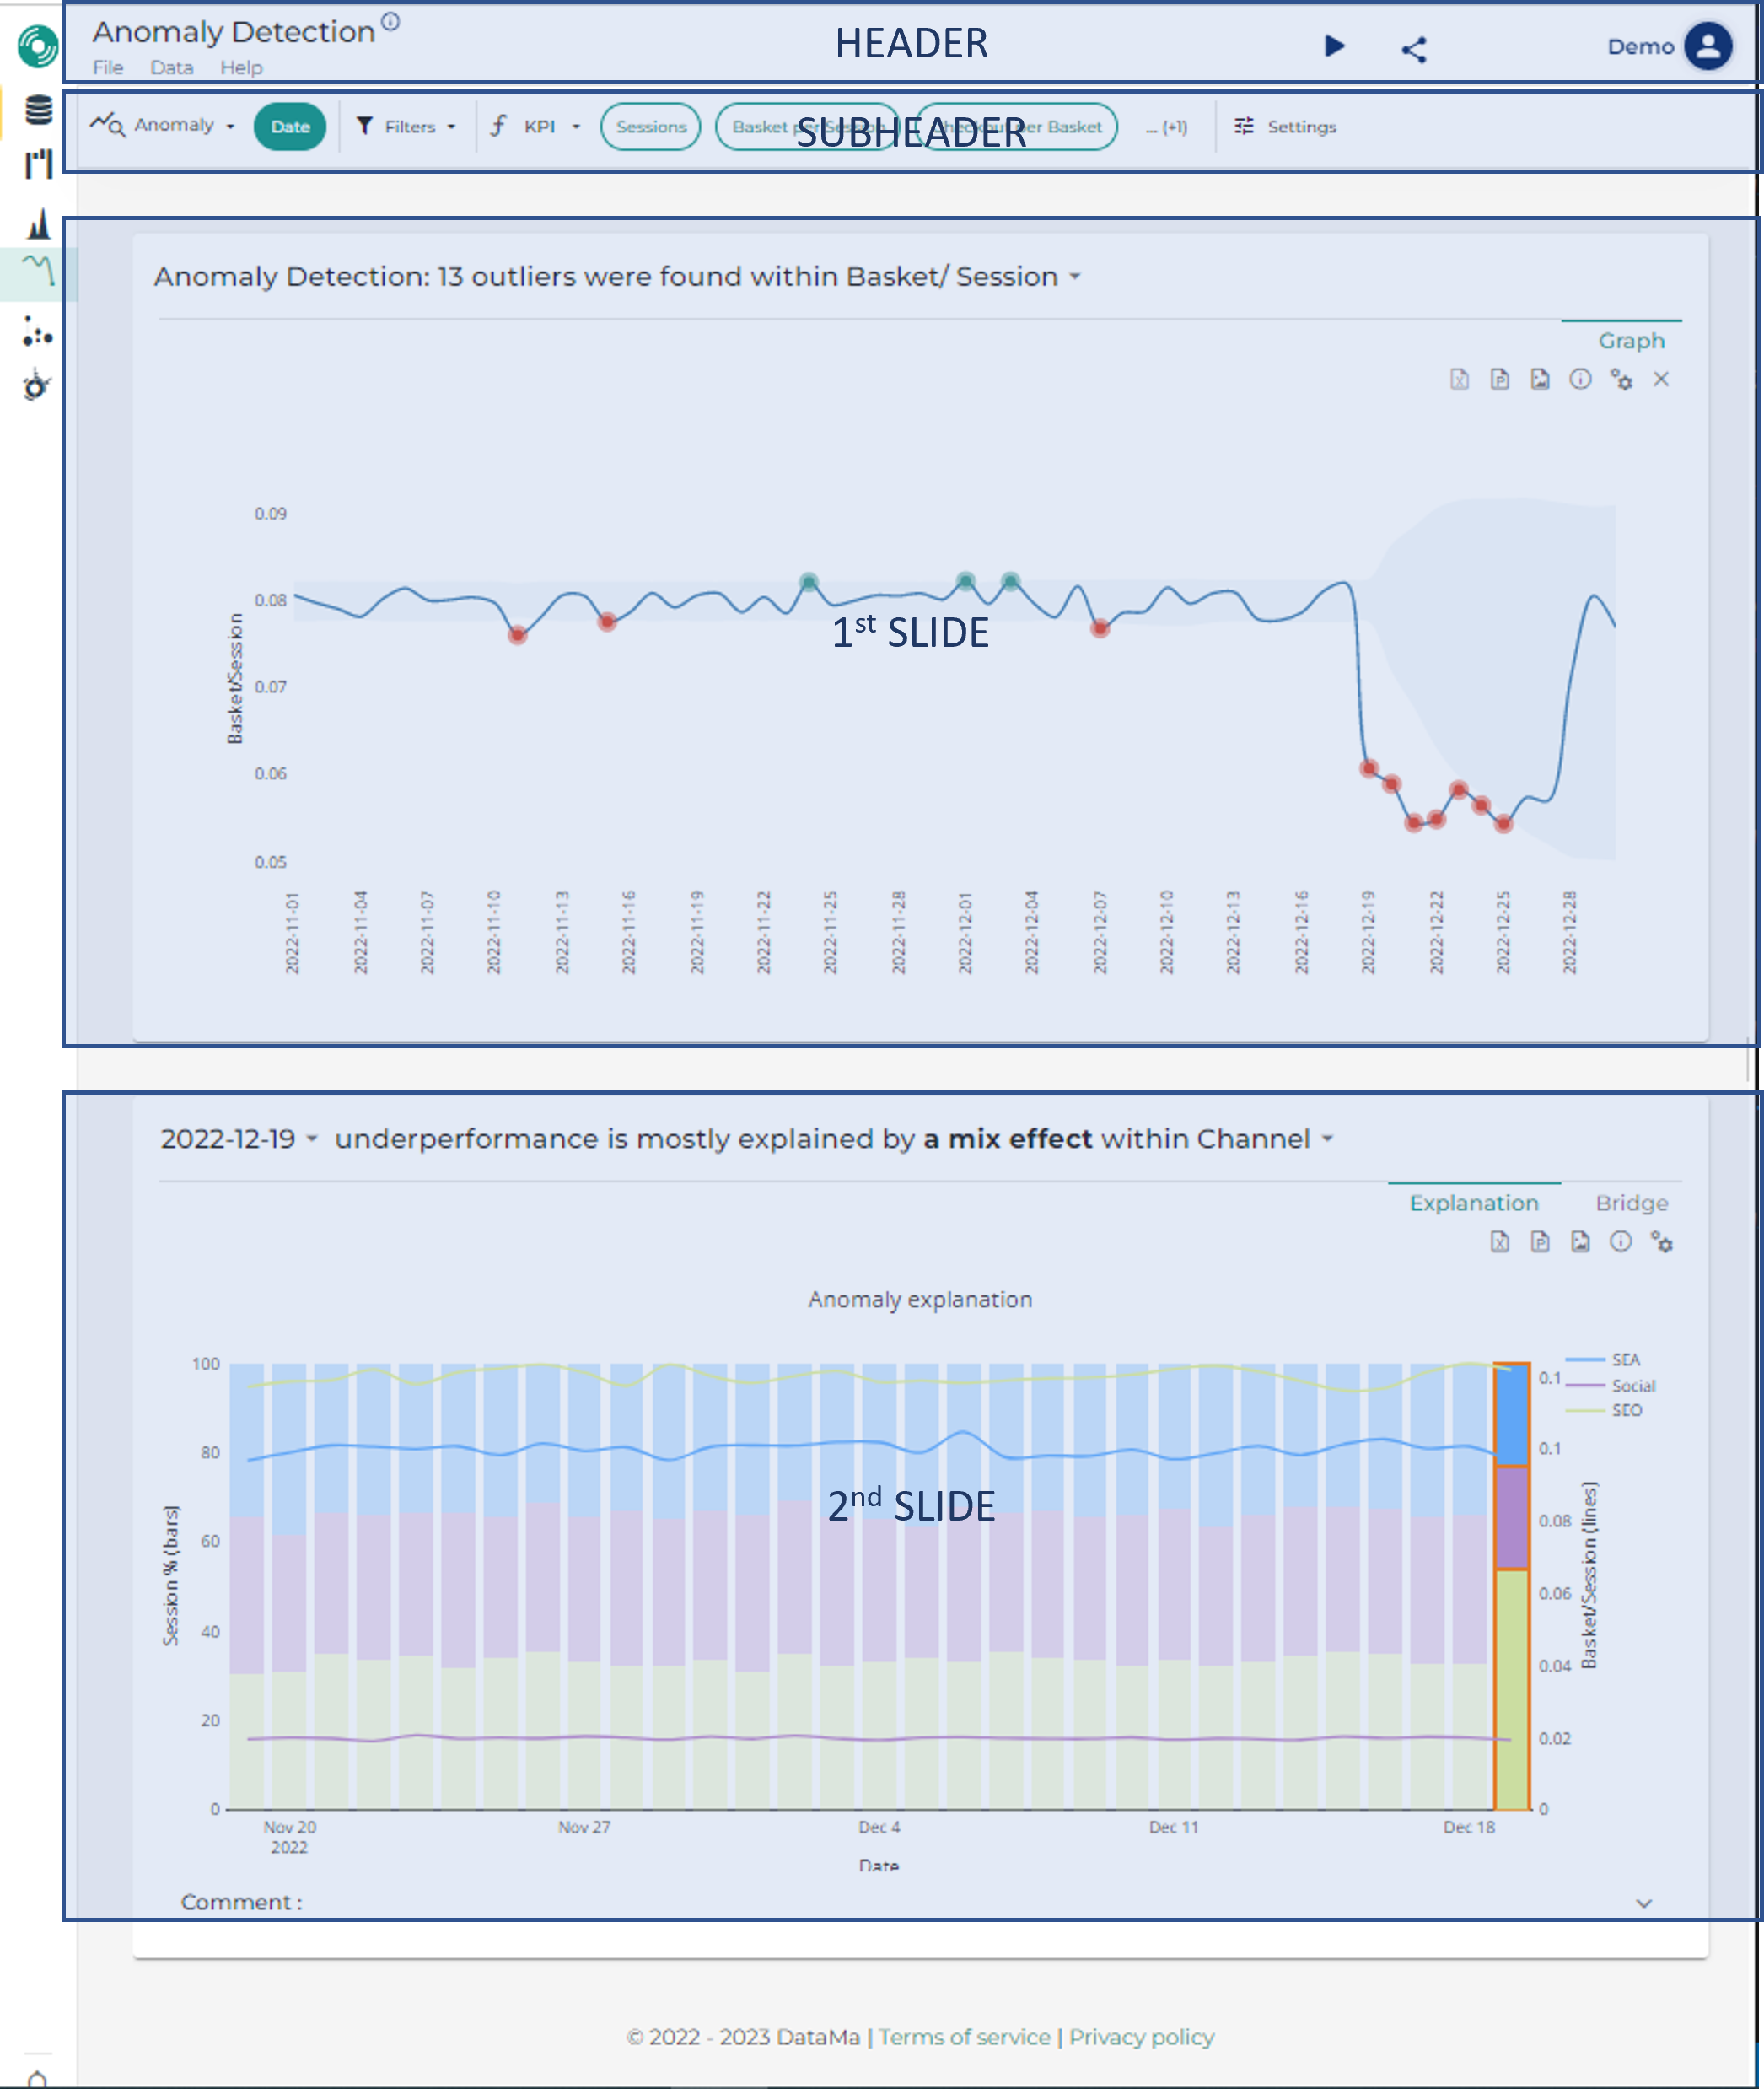
Datama DETECT is composed of two different pages. One which shows the variation overtime and one which represents the detail on a specific anomaly.
1. First Slide
This slide represents a time series with all the anomalies (settings by default) or only a check on the latest available point in your dataset. Change this settings in the Subheader (Analyse Latest Point Only)
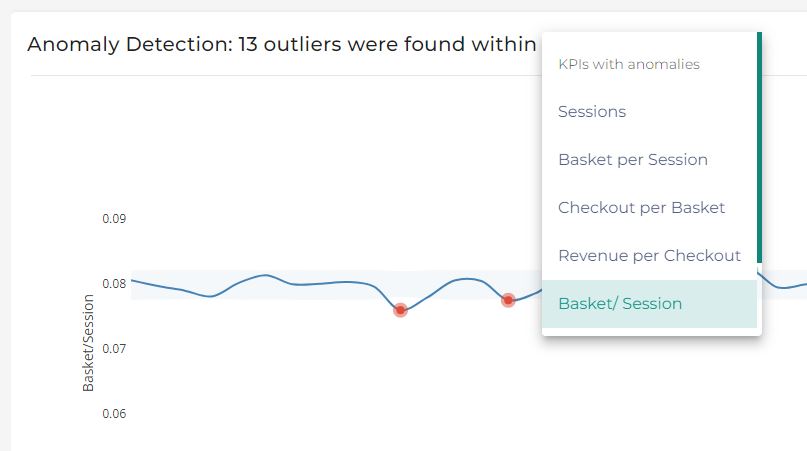
Change the ratio your are analysing by using the dropdown in the title. Within the dropdown KPIs are split between KPIs with anomalies and Others KPIs
By default Datama Detect is set to analyse each steps of your market equation but you can change it to only a specific step. (in Settings)
2. Second Slide
The 2nd slide is the explanation of a selected point in the graph above. The bars represents the denominator and the line represents the ratio of your KPI.
By using the dropdowns in the title you can either change the date you are analysing or the dimension.