Table
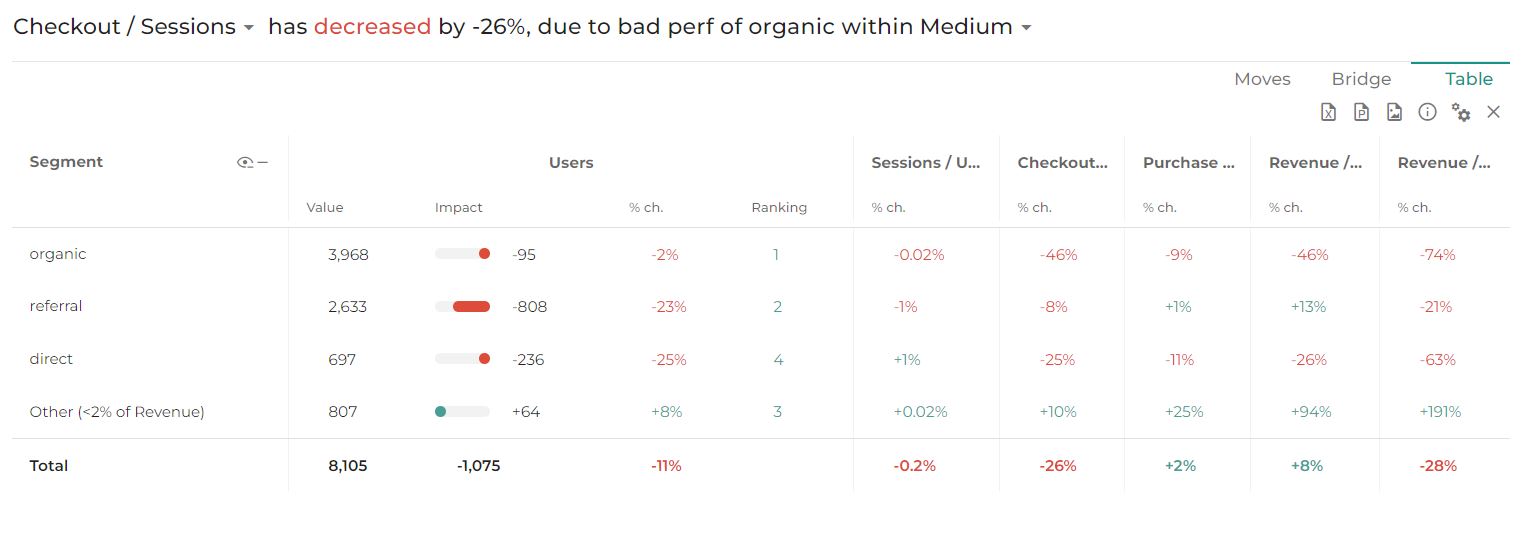
Table is gathering all the figures that helps to understand step variation and dimensions impact.
The table allows to access a detail view of the data with the ability to refine what you want to display.
1. What’s available on the table?
By changing the settings of the table you can choose to display 5 types of information:
- Value: new value of the ratio. (e.g: 2633 Users in referral for “this year”)
- Impact: the impact of the change between Start and End on the considered KPI
- Main KPI Impact: the impact of the change between Start and End on the total KPI in your market equation
- %ch: evolution in percentage between Start and End
- Ranking: Ranking of each element of the dimension by size at the End
- Ranking change: evolution of the Ranking between Start and End
Note that when activating a “Secondary Comparison”, the secondary comparison values are displayed in the table in a subline in italic under “2nd comparison”
2. How could it look like?
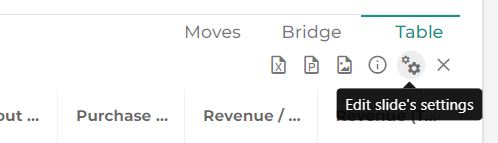
Change Formatting of the table by clicking on the Settings icon:
The display is adaptable according to your needs.
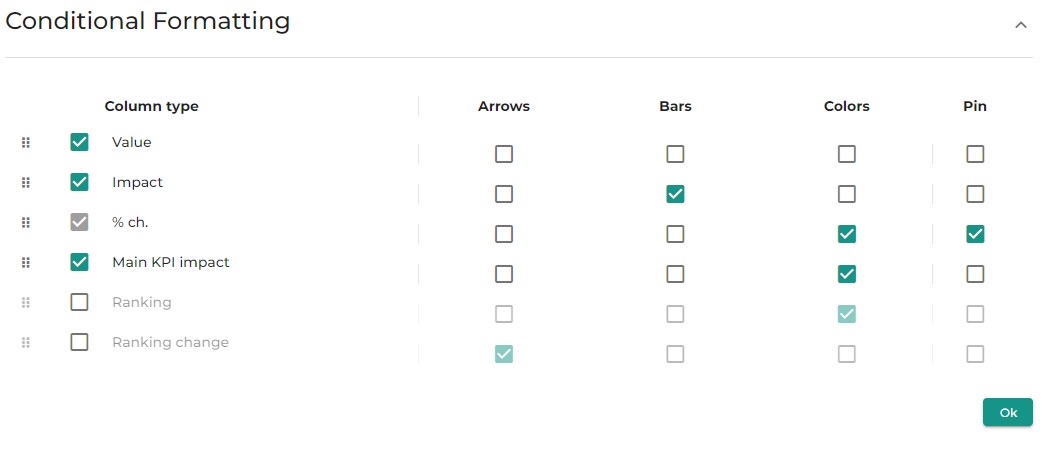
- Arrow: Displays an arrow that goes up or down depending on the positive or negative variation
- Bars: Displays a bars filled according to the impact on the total variation of this step
- Colors: Figures are colored according to the positive or negative variation
- Pin: Displays the figures even if the Step is closed. By default only “%ch” is pinned.