Drill down hierarchy
Drill down hierarchy is in beta 🧪 right now and unactivated by default. Please send us any feedback to get this improved!
1. General usage
The drill down input can be defined in Settings > Drill down hierarchy. It allows to define the methodology to break down main KPI variation. 3 options are available:
- By Steps then Dimensions
- By Dimensions then Steps
- Auto
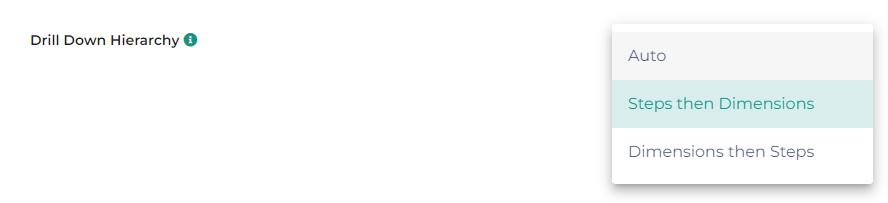
Once activated (i.e. default value is “Steps then Dimensions”), Datama uses what is calculated as the most interesting drill down. Yet, you can manually change the drill down by right clicking on a total bar of the waterfall and selecting the desired drill down
2. Available drill down hierarchy
2.1. Steps then Dimension** (default setting)
By default, the main entry point for Compare analysis are the steps of your market equation, a.k.a. metric relation.

Then, within each step, Datama helps you find what is the most interesting dimension to explain the gap of a given steps. This is the default way of working of Datama Compare, as specified in (Model details)[https://Datama-solutions.github.io//docs/core_app/new/compare/model/model.html]
*2.2. Dimension then steps**
When your main KPI is the result of a simple computation (i.e. product or sum of metrics steps), Datama is able to breakdown the impact of each segment of each dimensionon the main KPI.

This is particularly interesting in cases like
- your final customers want to see a split by segment first on main KPI before having the details by sub-PI (e.g. breakdown by country when it fits with different entities/ targets/ incentives of your organisation)
- one step of your market equation impact compensates the next step and there is no much business interest in explaining one drop on one step, and then an increase on the other step (e.g. switch of a step of a funnel from one year to another)
By activating the “Dimensions then Steps” option, you will see the impact of the top 5 segments of the most interesting dimension for the total step variation to explain the gap. Then, by clicking on a given segment, you will be able to get the details of the impact of each step of your market equation on that specific segment.
The title and comment of the first slide of Datama Compare are also updated to use the most interesting dimension wording
Few tips to consider
- Calculating Step impact for each segment of each dimension takes time (typically 3-4x the default time of computation) - make sure to activate only when needed
- You can force Datama to consider the most interesting dimension (hence, the first dimension displayed) to be a given dimension by defining it as “Focus dimension” for the total step in the Metric Relation definition
- When looking at a ratio for the Main KPI, Datama might find useful and necessary to separate mix effect before splitting by segment. You can avoid this by setting the “Split Mix and Performance” setting to “Never”
2.3. Auto
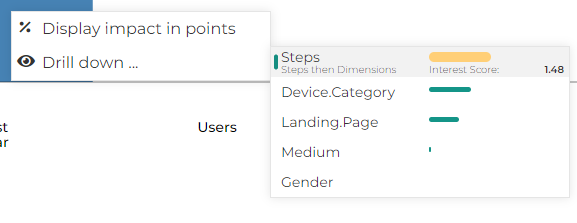
Auto mode lets Datama score the interest of splitting by “Steps then Dimension” vs. all the different variants of “Dimensions then Steps” using an interest score. You can see the interest score by right clicking on the total bar and reading the contextual menu. While the absolute value of the interest score has no much interest, the ranking helps in finding the proper approach for explaining the variation. Datama considers the share of the total gap explained by one specific step vs. the share of the total gap and relative variation of the biggest segment to create that score.
Few notes
- Using “Auto” mode, the most interesting drill down hierarchy might change depending on the data for a same use case. Make sure you explain this clearly to final users before sharing!
- In the total bar right click context menu, the type of drill down can be understood by a color code (green for “Dimension then Steps”, yellow for “Steps then Dimensions”)