Moves
In the Detailed View the graph « Moves » represents a key element. It allows you to deep dive in all and every dimension and elements of your dimension and understand Mix effect and Performance effect.
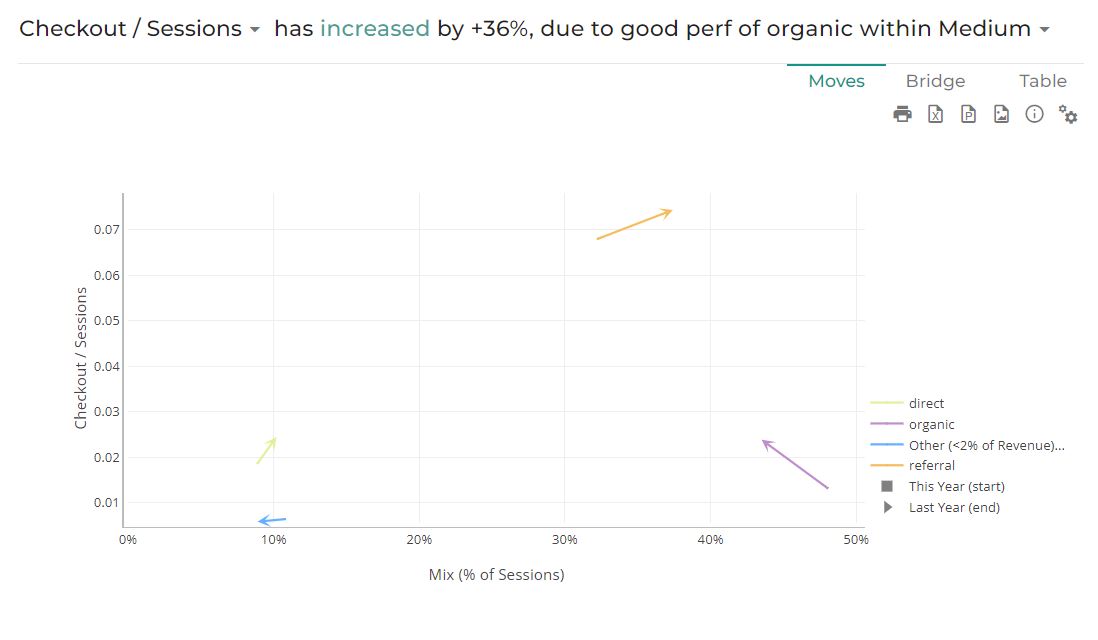
This graph shows the performance effect and the mix effect within a single serie of arrows (or vectors). The start of the arrow represents the Start point of your analysis and the end of the arrow represents the End point of the analysis. An arrow is either an evolution of the performance effect and the mix effect from Start point to End point.
1. How to understand this graph?
Read more details on Mix & Performance Effects.
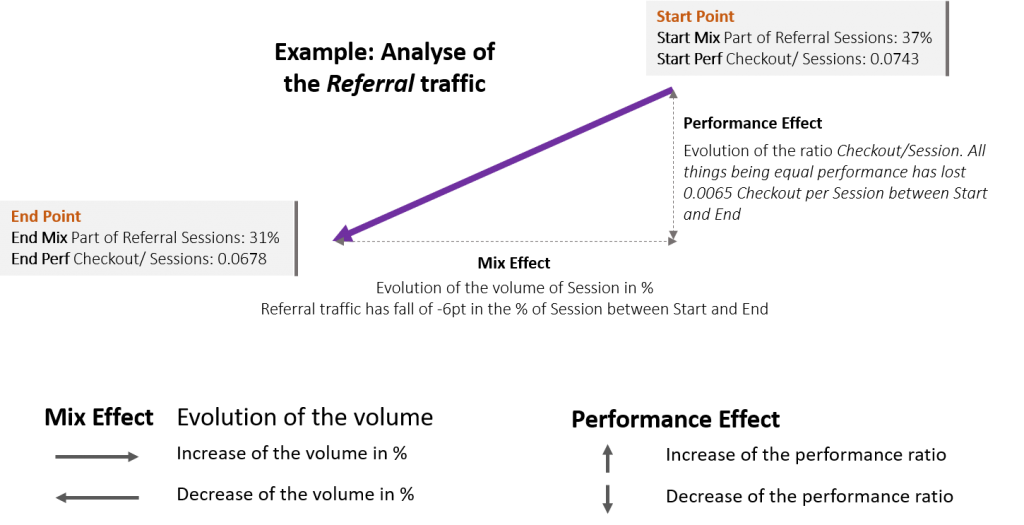
Abscissa of this graph is the Denominator of the Step, what we call the mix effect. It represents the evolution of the breakdown in input and in output (e.g. in the picture above, the abcissa is the % of Session by type of Medium. The purple arrow « Referral » goes from 37% of the Session in input to 31% at the End. This will have a mix effect. There is a decreased in % of this type of traffic).
Ordinate of the graph shows the ratio of this step Numerator / Denominator (e.g. in that case: Checkout/ Sessions). This is the performance effect of your analysis. (e.g. in the picture above, the ordinate is the performance of the Checkout/ Session as if the Session was equal betwen Start and End. The purple arrow « Referral » goes from 0.0743 Checkout per Session in Start to 0.0678 at the End. This have a negative performance effect).
1.1. Help on the read of this graph
To have keys to read this graph, you should know few tips:
- The higher the arrow the higher the performance. In our example, the purple arrow is higher than the others, which tell us that the Checkout/ Session of the referral traffic is the best among all the type of medium. If the volume of referral traffic decrease, there will be a direct negative mix impact on your activities, you will have more traffic coming from type of medium with a lower conversion rate than the referral traffic.
- Others (<2%) grouped: Datama aggregates within a dimension, elements that represent less than 2% of the total. This will appear as a row in the graph, but you can change the aggregation level from 2% to 0% or whatever you want, depending on the details you want to display.
- Show average ratio: This allows to show the weighted average of all segments on horizontal lines, for both start and end. It helps you understand which segments are above or below the total average.