Assess - Settings
Here is the different settings available in Datama Assess
Here’s what you going to find in this chapter:
1. Statistical approach
1.1. Test to Compute
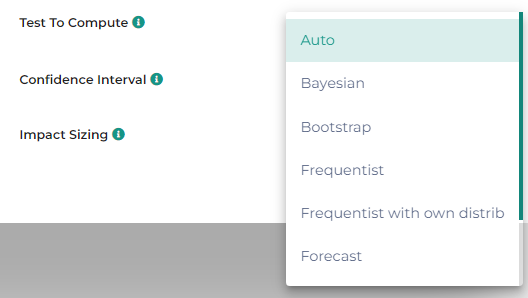
You can decide which test to perform depending by selecting the appropriate model. Please refer to the Model section for more details
Go to the advanced setting:

Find your model here:
1.2. Confidence interval
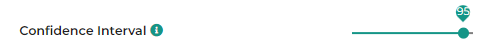
Confidence interval is set in % to decide the level of confidence, or statistical power of your assessment. It ranges from 50% to 99%.
Depending on the test you are performing, this input can be used in different ways. Please refer to the Model section for more details
1.3. Frequentist Weight

The Frequentist Weight parameter allows you to select a metric that will multiply the number of occurrences of a given line by that metric.
For instance, if you’re analyzing the significance of a variation of Average Basket value in an AB test, you would need to have 1 line per transaction, so that Datama can compute the standard deviation of that Revenues generated per transaction. However, since you have many transactions, you could end up with a too large dataset. To avoid handling large datasets, Datama allows you to define a “weight” for each line, and in that example you could group transactions by bucket of Revenues. This dataset is a good example of that transformation from this other dataset, where “Lines” will be used as denominator for the KPI and “Weight” column as the weightening for Revenue/ Lines ratio. Note that the second data set is smaller than the first one, and gives the same results.
1.4. Causal Impact

The Causal Impact test allows for the assessment of the significance of a variation between pre- and post-intervention periods on a test group. To read more about the Causal Impact test, please refer to the relevant literature.
1.4.1. Impacted Dimension
Impacted dimension refers to the specific metric or variable that you are evaluating to determine the effect of an intervention. This could be any quantifiable measure that you believe is influenced by the intervention, such as sales figures, website traffic, customer satisfaction scores, or any other key performance indicator (KPI).
To conduct this test in datama assess, first define the dimensions impacted by the change. In this context, you will have a “Control” group and a “Variant” group.

1.4.2. Impacted Segment
Impacted Segment refers to the specific part of your data or population that is affected by the intervention being studied. This is usually the “Variant” group, which is subject to the change or treatment, as opposed to the “Control” group, which remains unaffected. (see the screenshot above)
2. Advanced settings

2.1. Aggregation in %
Level of aggregation: The level of aggregation that the model is using
e.g. if Level of aggregation is set at X%, segment within each dimension that represents less than X% of the Primary Numerator (e.g. Revenues) of the main KPI you’re analyzing will be clustered in one « Other » segment. X is set at 2 by default, but you may want to play with this parameter quite a bit because it can change significantly the calculation of mix effects.
- Click on the drop-down arrow to display the settings menu

- Move the cursor to the right to increase the level of aggregation

- Segments are now aggregated at the requested level
2.2. Significance for each Segment
This parameter is activated by default. This allows to calculate the significance for every Dimension, and for every Segment within Dimensions. Deactivate this parameter to accelerate time of calculation.
2.3. Cumulative significance
This parameter is de-activated by default. Instead of calculating the significance independantly for every segment in a dimension, it will add every segment with the previous one. This is interesting when you are mesuring the significance for date, it will allows you to measure at which date you reached the significance.
3. Basic settings
3.1. Comparison
First thing you need to do in Datama Assess is to define the comparison on which you want to assess the significance.
Please refer to the Dimension Comparison section
3.2. KPI
In Datama Assess, you can assess the significance of a variation only on one given KPI. Hence, you need to select one of the step of your metric relation for that KPI. By default, Datama selects the first ratio of your metric relation, but you can change that by clicking on the KPI bar in the subheader and ticking the appropriate metric within your metric relation

If you want to assess the significance for a KPI that is not explicitly in your metric relation, you can still edit the numerator and denominator manually by clicking on the KPI pill. See specific section for more details on the KPI pill
