Assess - Volatility model
Datama uses normal distribution quantiles to identify outliers and spot “abnormal variation”.
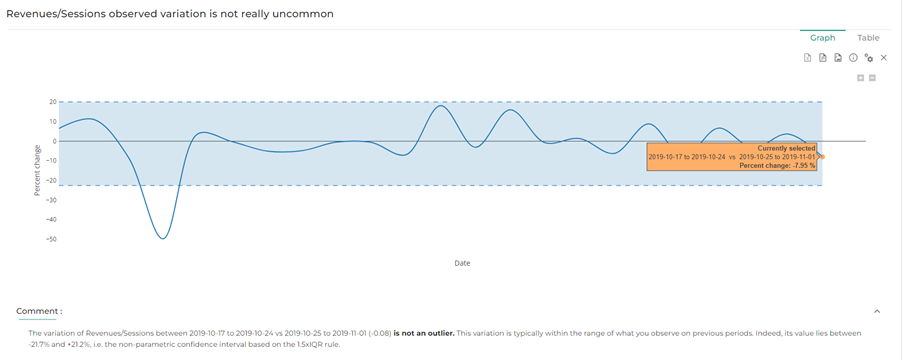
Volatility test applies when you compare two periods of time with the same number of days, and you have other historical data in your data source to compare the variation you have between your two periods vs. historical variations between same time ranges.
For instance, in a given year, you want to assess the significance of the variation of Revenues/ Sessions from week 45 to week 46. A good way to do this is is to look at previous variations from one week to the next (ie. week 43 to 44, week 41 to 42 etc), and compare those variations to the one of the week 45 to 46. If the variation from week 45 to 46 is outside the distribution of previous variations, then it can be considered as a significant, abnormal variation.
Datama uses normal distribution quantiles to identify outliers and spot “abnormal variation”. It is possible to adjust sensitivity using the “Confidence interval” slider in “Settings”.
Behind the scenes: Datama Impact chooses the ETS or STLM model which best fits the Start period data, taking seasonality into account, and then computes predictions for the End period. This allows us to test whether realized (a posteriori) values significantly differ from what could be expected a priori.
See also: wikipedia
Test data: Gsheet