Assess - General Interface
Datama Assess allows you to quickly assess the statistical significance of a difference on any KPI between two points
Datama Assess dashboard is made of two slides:
- Overall Significance
- and Significance by Sub Segment
1. The overall Significance
This is where you can see the output of the statistical analysis :
- a title saying whether or not the difference is significant
- a chart showing the visual outcome
- a comment explaining the outcome in plain language.
Please refer to each Model documentation to better understand how to read it. By default, Datama will select the model that best fits the type of data you’ve connected, but you can force it to a certain test using the test to compute (add link) parameter
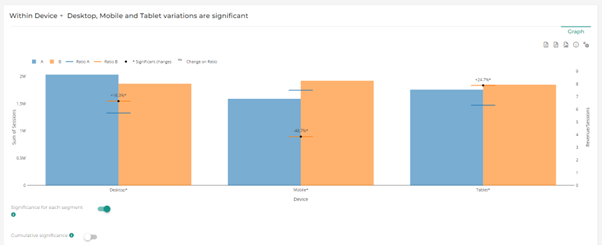
2. The Significance by sub segment
In this slide you can read the statistical significance of the variation within each segment of a given dimension of your dataset.
For instance, you could read the significance of the difference of website conversion between two variants of an AB test on each device on which you were testing on
The dimension you’re looking at can be changed in the drop down menu in the slide title on the top left corner
The chart shows, for each segment of your selected dimension and between each point of your comparison (Blue and Red Colors)
- The value of your KPI in lines (horizontal “gant” lines if you are looking at a discrete dimension, continuous lines if you are looking at continuous dimension)
- The value of the denominator of that same KPI in bars (for instance volume of sessions on a transaction/ session KPI)
- The % change of the KPI in dark text
- If that % change is statistically significant, a dark dot and a “*” flag on the variation and the name of the segment
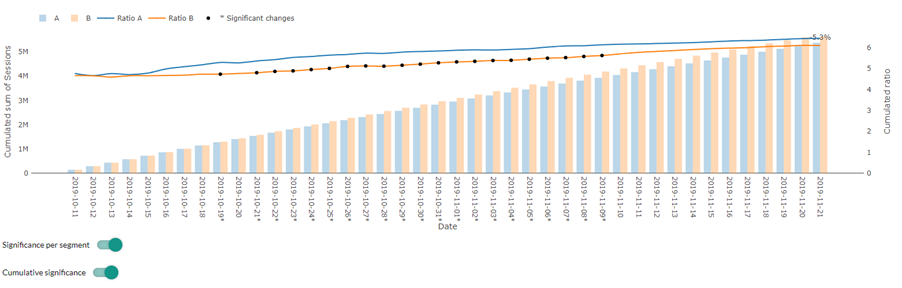
For performance reason, you can decide to deactivate the computation of significance for each segment of each dimension in case the test you’re using is particularly costly in computation time (e.g. bootstrap or forecast)
You can also decide to compute a cumulative significance: This is particularly useful when computing significance for each day of a time period, to cumulate previous days in your significance calculation as in the example below