Simple Stat
The Simple Stat tab is a graph allowing you to visualize various information on the steps of your customer journeys:
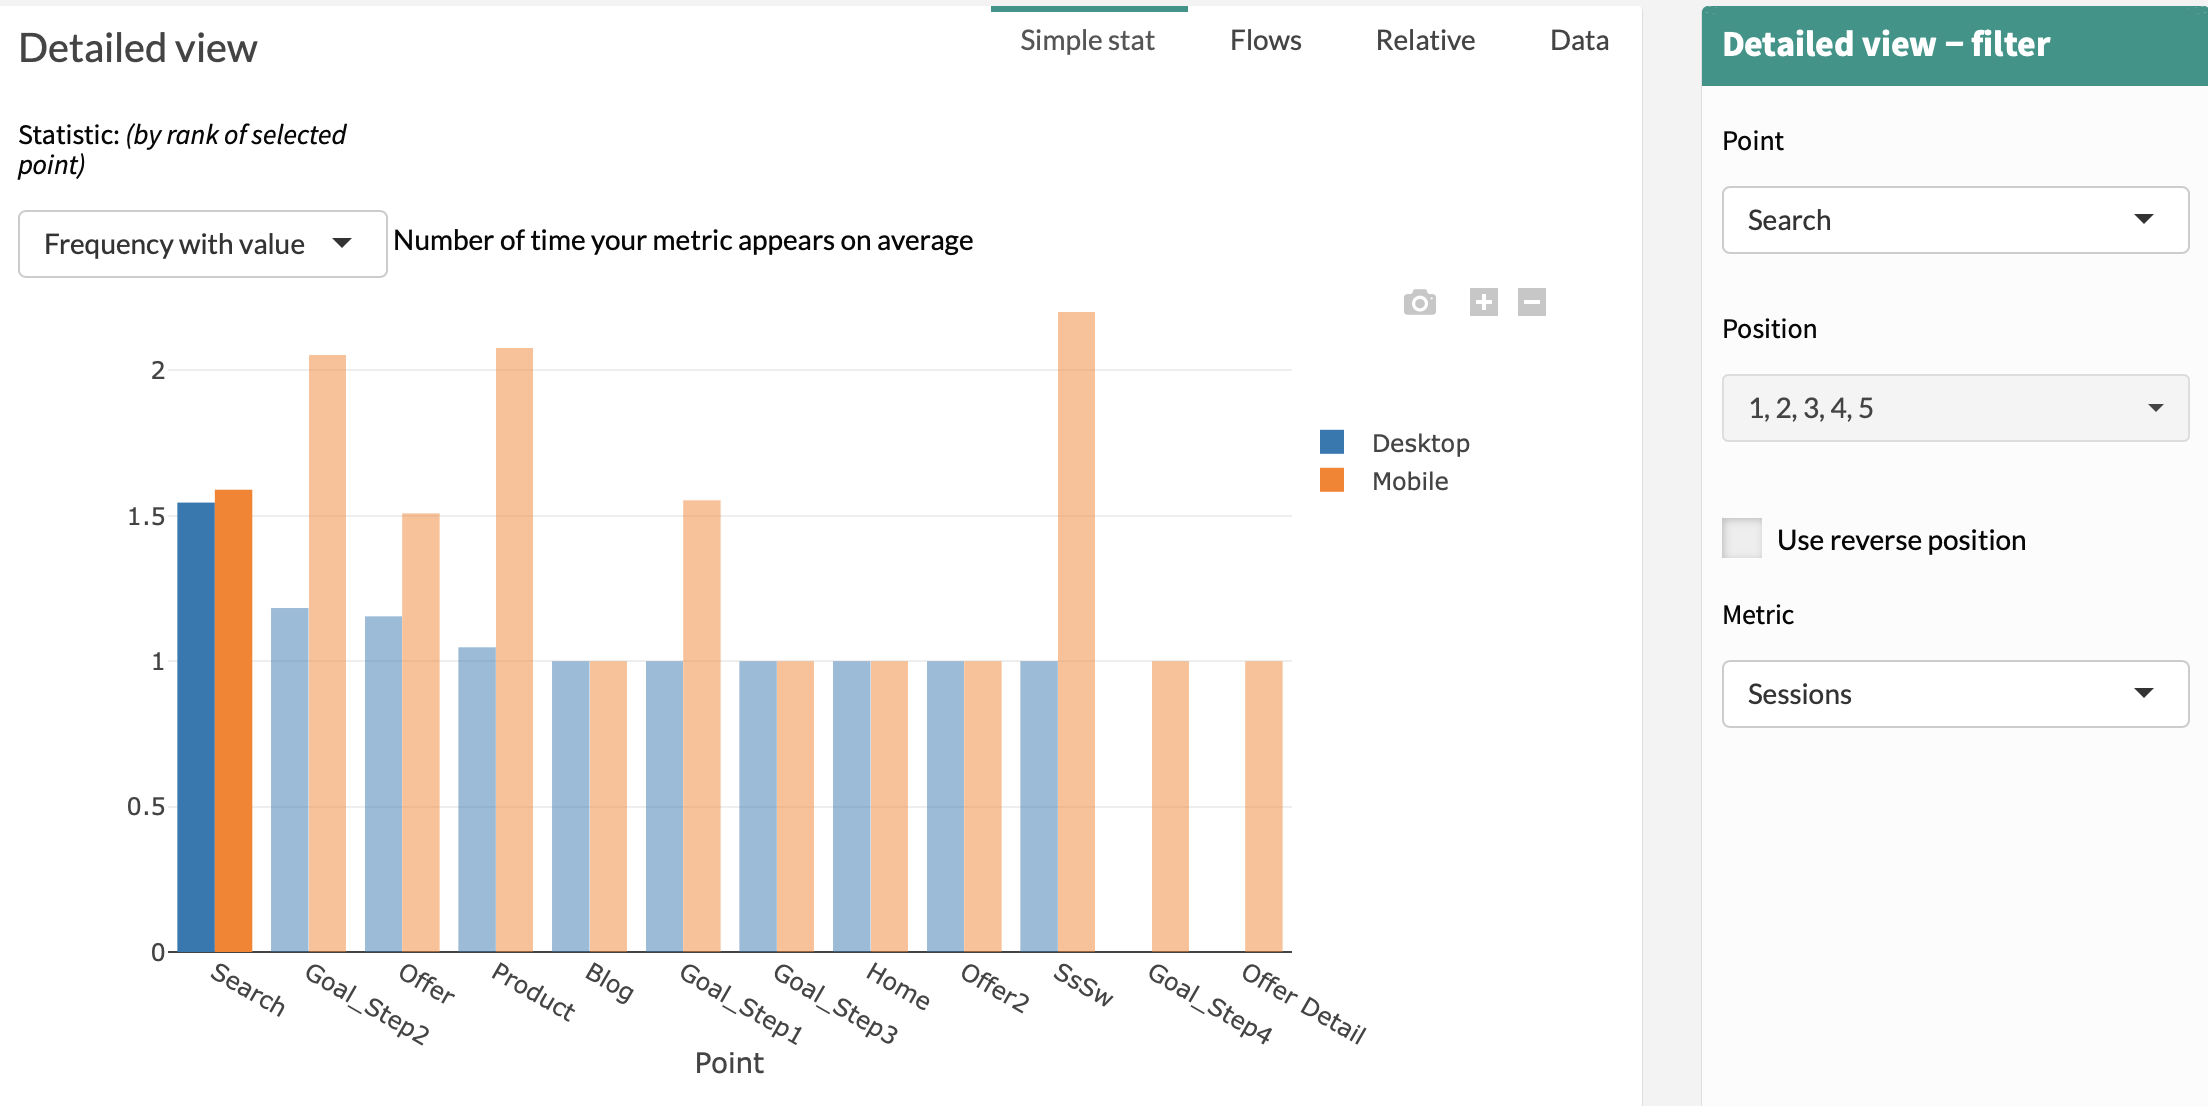
- Frequency: number of time your metric appears on average.
- Appearance: presence probability of your metric in journey.
- Length: Average journey length when your metric appears
Example: