Dimension analysis
Each performance is composed of a Mix effect and a Performance effect.
This chapter will describe both effects to allow you to properly understand the underlying composition of your performance.
Mix Effect
Effect of the change in the mix in input.
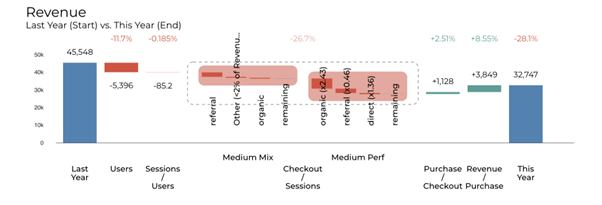
The mix effect is the impact on your performance that is coming from an evolution of the distribution of your population in input. If you have more people in input with a better conversion rate, you will have a positive mix effect due to the type of clients coming into your store or your website. This graph represents the sum of the Mix impact of each dimension at each step of your funnel. The red dot represents the gap your are trying to understand at this step of the funnel.
Model of Mix effet
Impact of the evolution of the volume breakdown in input.
e.g. If you are selling several products, and if the share of an individual product in the portfolio changes, there will be a mix effect.
● For each step, mix effect calculations scaled using waterfall analysis output to be able to size impact on overall metric ● While each different segment of one dimension is contributing differently to the mix effect, we represent the sum of them
Example in eCommerce
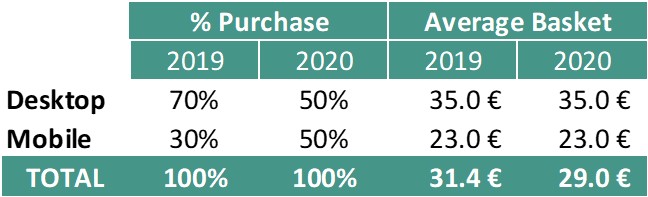
For instance, say mobile users convert much lower than desktop users (which is often the case). If last week you had much more desktop users than this week, then the conversion this week will be mathematically lower, just because of that change in device mix. What Datama Mix effect analysis does is just replicating that logic but for each step of the funnel and for each dimension provided in the data set. As long as those dimensions are not interdependent, you come up with a share of the gap on each step that can be attributed to mix effects on a given dimension. In another way, the Mix effect is the impact due to the change of proportion in entrance. As in the example below, when your proportion of Purchase between Devices change, that automatically changes your Average Basket. In 2018 70% of purchases were made via Desktop, compared to only 50% in 2019, with a stable average basket of 35€ ● If the proportion changes it’s a Mix effect ● If the average price changes, it’s a Performance effect
Performance Effect
A performance effect is an observed difference in a performance. For example, selling a different number of cars between two weeks has a performance effect. Having less users on a website is a negative performance effect.
All things being equal, the performance effect is the evolution of a performance. As presented below the performance effect could be represented at each step of your metric relation and for any dimension.
Concept of segment performance
The performance effect is the variation which is dedicated to the dimension’ performance on its own. It is to be distinguished with the variation due to the volume changes (mix effect + covariance) that can’t be attributed to one of the dimensions you are following.
● For each dimension on each step, flagging segments driving most of the change (Min and Max,, depending on whether this step is going up or down) ● Important metric to consider is the ratio change relative to average ratio change, to assess how much this is ‘normal’ given traffic on this segment