How to use Datama Compare (Light) in Looker Studio
Using Datama Compare as a Looker Studio extension is a great way to make your report more insightful with the benefits of both.
1. Overview
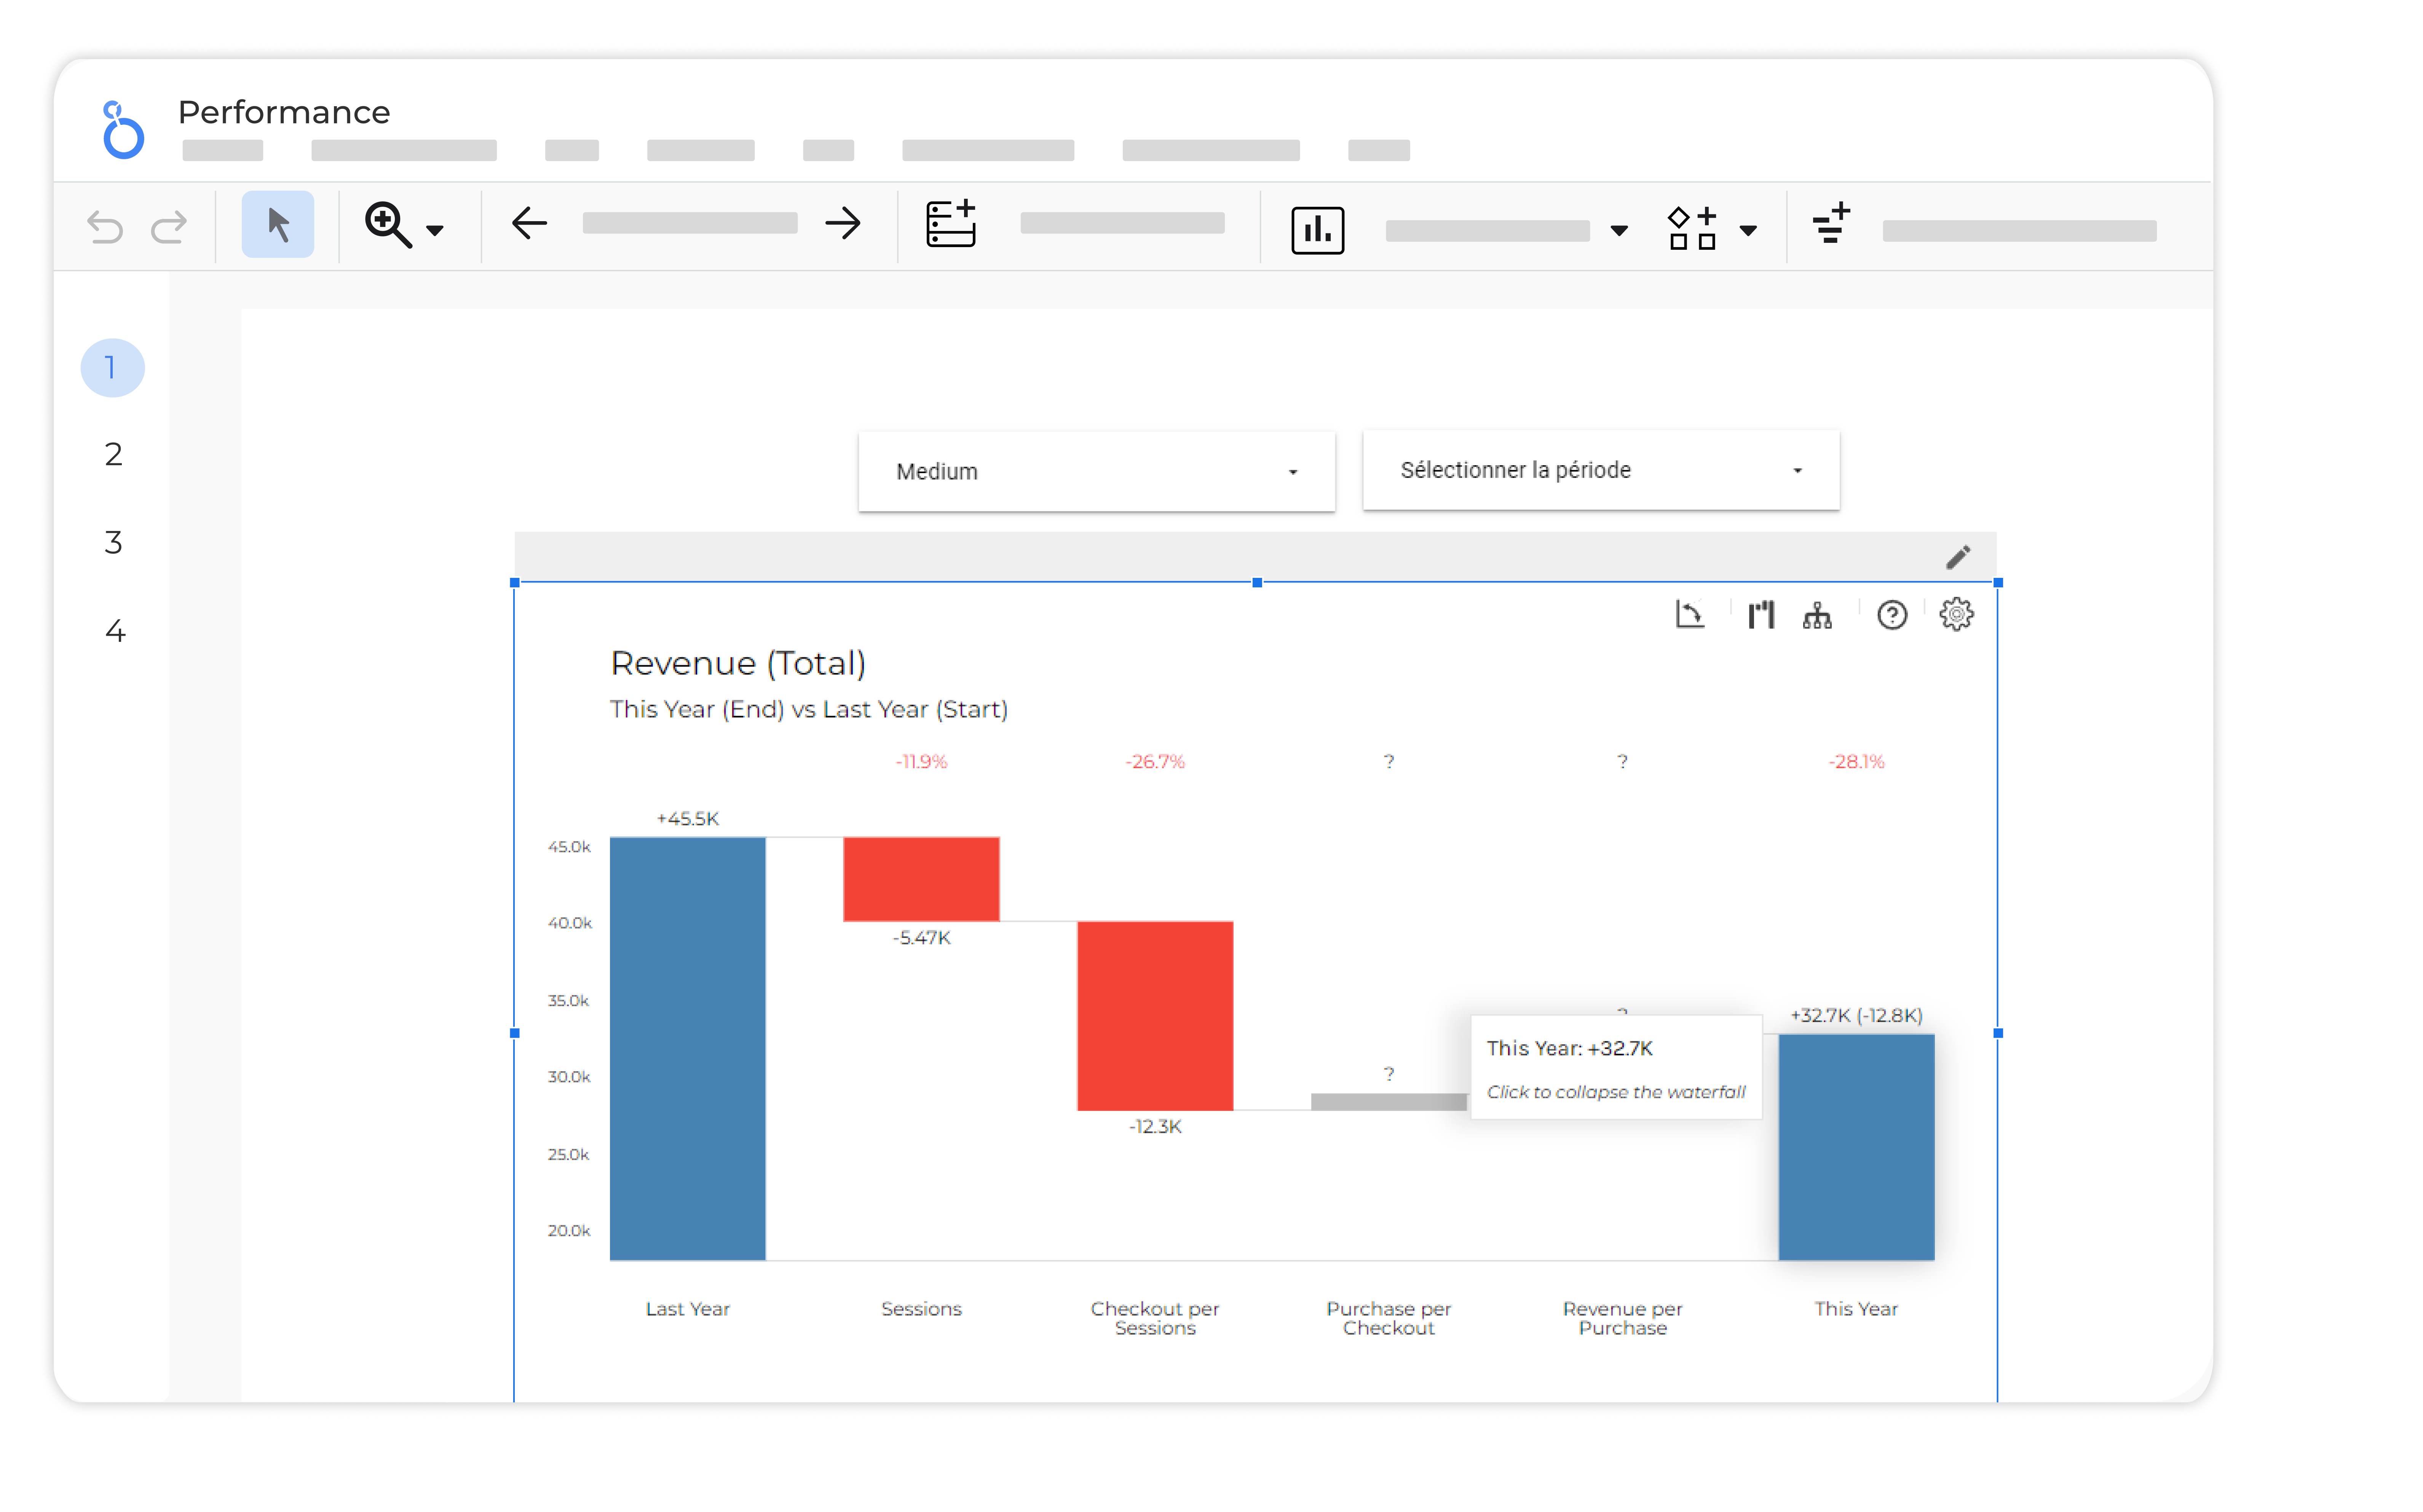
This document provides detailed documentation for the “Datama Compare - What’s driving my variation?” plugin, a powerful extension for Looker Studio. This plugin enhances data analysis capabilities by explaining performance variations with easy to understand data waterfall graph.
Below is a short intro video
2. Features
- Multi-view workspace: Waterfall and smart comment pinned side by side by default, with optional table and tree views.
- Smart scoring engine: Automatically identifies and displays key factors that explain performance variations, simplifying complex data.
- Mix effect analysis: Assess the specific impact of Mix effect on your performance metrics.
- Intelligent Comments: Convert data analysis into smart, actionable insights; narrative stays in sync when you drill or Split by.
- Interactive charts: Zoom, click, filter, dimension drill-down, custom pillars, and a richer right-click menu (bars and labels).
- Side settings panel: Configure Comparison, Modeling, Market Equation, Chart, Colors, Waterfall, Tree, and Table next to the viz (Apply vs live).
Tip of the Week 130: Customize comments in your Datama extension!
✨ Want to add your personal touch to comments while interpreting comparison analytics from the Datama extension in Looker Studio, PowerBI, or Tableau? 🤔 Yes, you can! 🌈 Say goodbye to default comments and hello to your custom insights below the waterfall chart ! 🎉
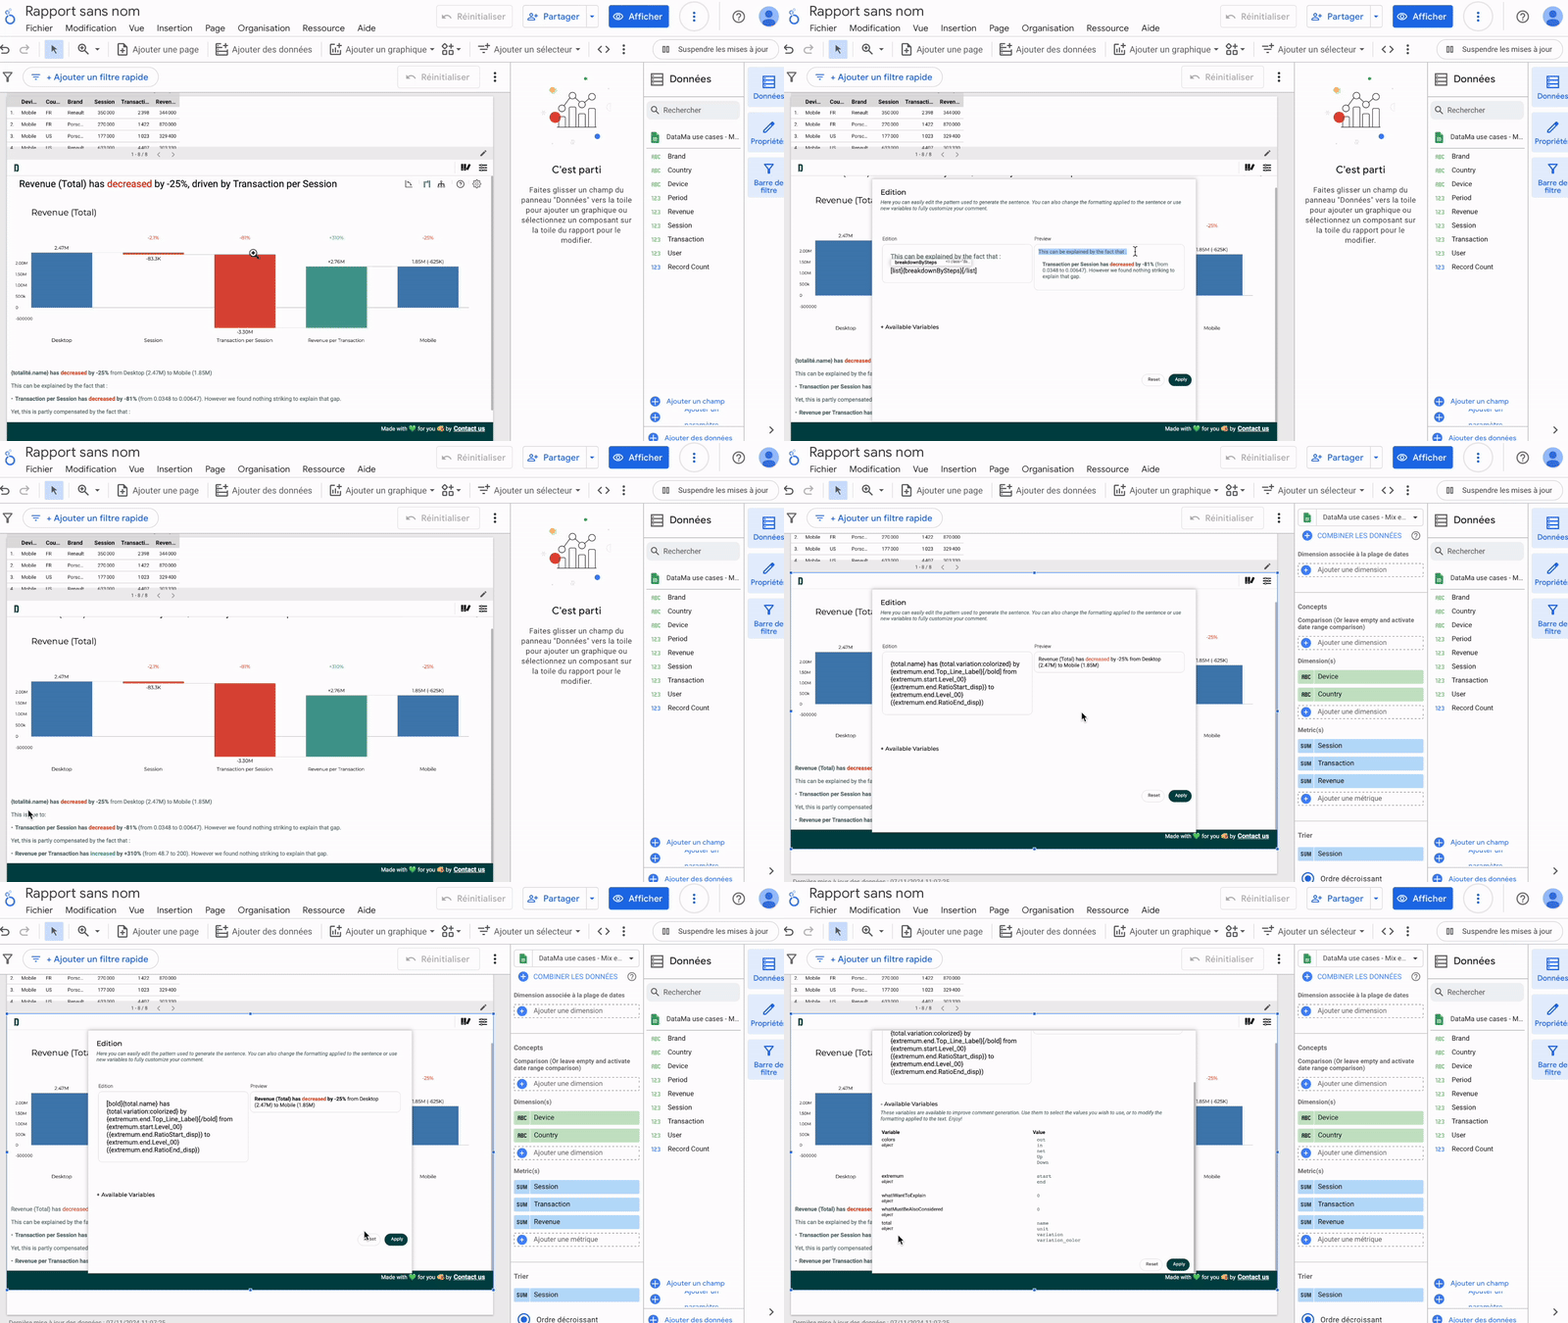
Only 4 steps to get it done:
- Right-click on the sentence you’d like to modify and select “Edit Sentence” to open the settings panel.
- 📝 Edit the relevant text in the left coding panel. Check out your changes with a 📺 live preview on the right!
- When ready, ✅ click “Apply” at the bottom right to save your changes and see the update instantly.
- Need to Reset? Click “Reset” (left of “Apply”) to return to the default style if you want to start over or if an error pops up.
Advanced customization: Click “+Available Variables” for even more options!
🎥 See below our GIF guide for a step-by-step walkthrough.
📊 Make your Datama Extension uniquely yours! Humanize your analytics tools and bring clarity to your data insights!
3. Add the extension into your report
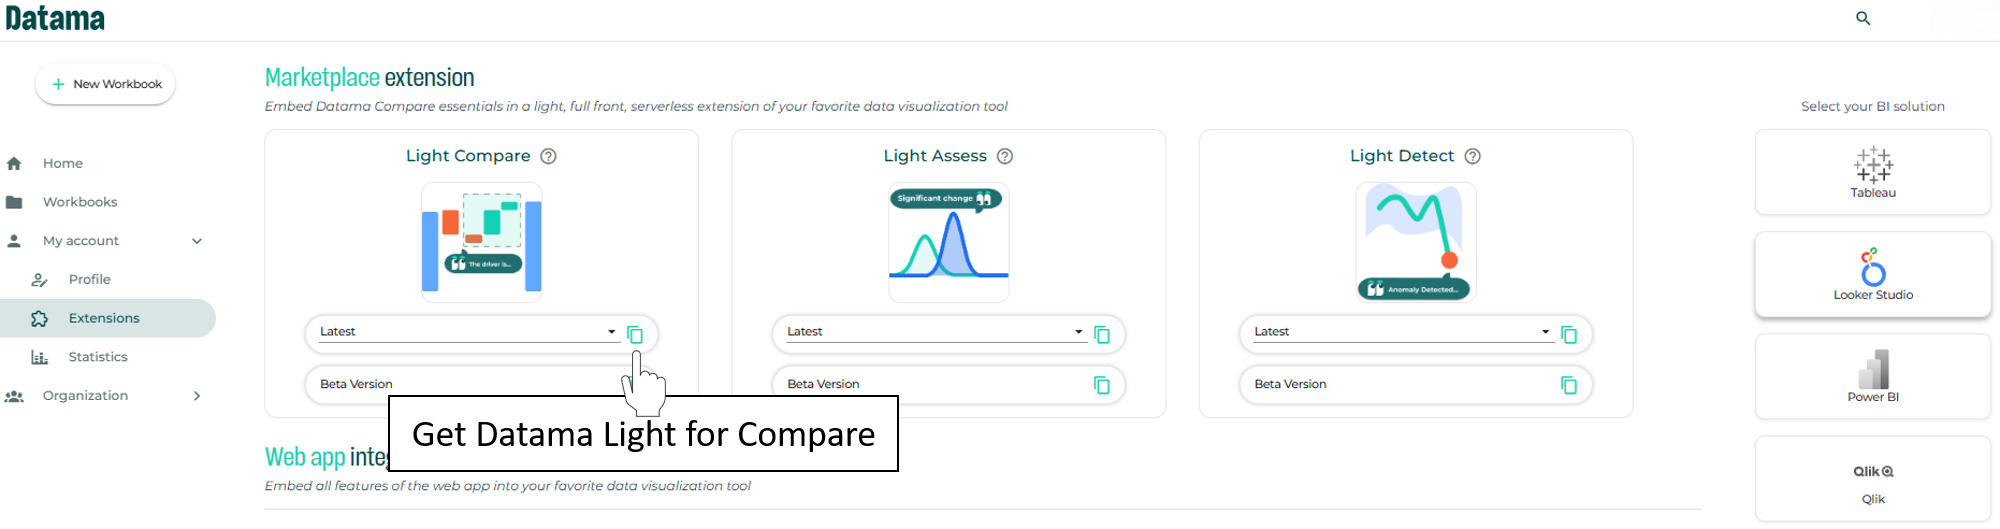
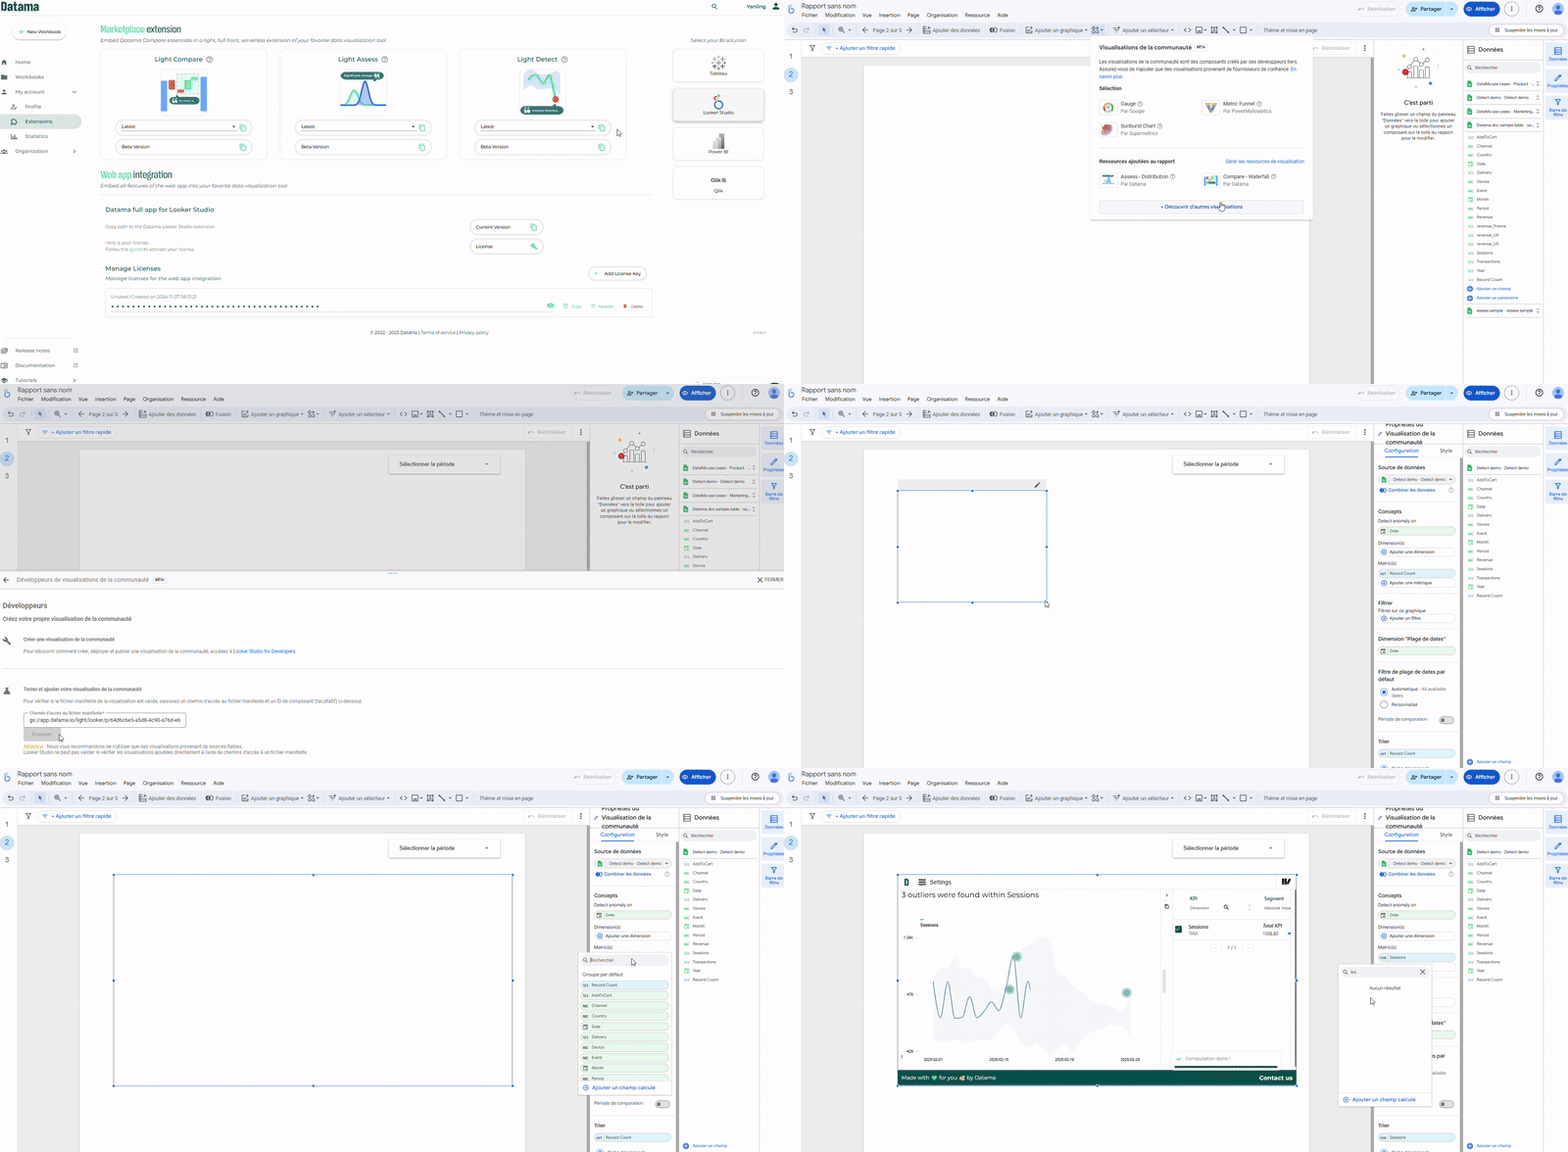
In order to use Datama in your report, you need to start by creating an account on app.datama.io and go to “My account” then “Extensions” and copy the path from the Looker Studio extension.
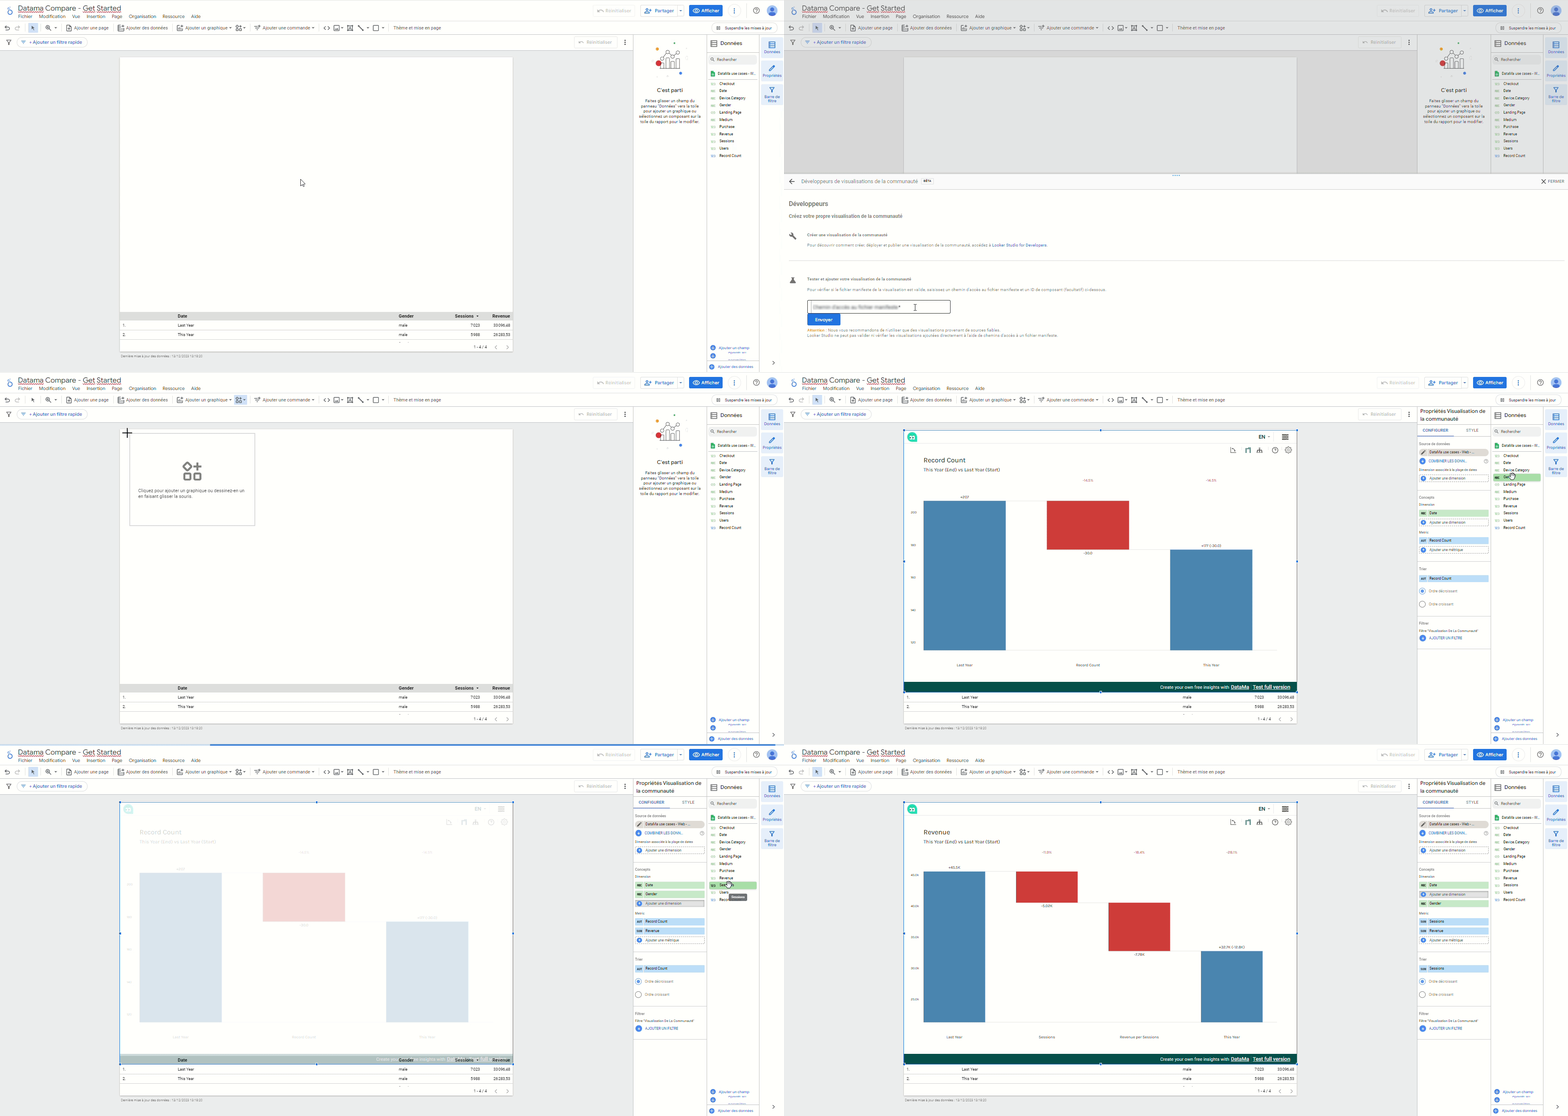
And then, follow these steps to add the Datama extension in your Looker Studio report :
- Edit your report
- In the toolbar, click Community visualizations and components Community visualization icon
- Click on “Explore more”
- Select the wanted Datama extension on the list OR choose “Create your own visualization” and put your visualization ID in “Path of manifest file” (by default you can copy paste this path:
gs://app.datama.io/looker-datama-light/compare)
Tip of the week 151: Use Datama’s extension in Looker Studio
Interested in Datama extension in Looker Studio? Here’s how to try it on with no hassle! 🚀
Step 1 — Get your Datama manifest link 🔗
1️⃣Log in to Datama https://app.datama.io/login
2️⃣Go to My account (left side)→ Extensions
3️⃣Under BI tools  (right side), pick Looker Studio
4️⃣Click the copy icon to grab the manifest URL (or license link) (in the middle)
Step 2 — Add it to Looker Studio
1️⃣In your report: Add a chart → Community visualizations → Explore more
2️⃣Click Build your own visualization
3️⃣Paste the copied link into Manifest path
4️⃣Submit → Allows adding → the Datama extension appears under Community visualizations
4. Get a free trial period
Datama extension in Looker Studio allows you to benefit from all features.
On top of this, the paid version allows you to
- Remove Datama Branding (Background logo and free pop in)
- Save your settings to find them back when you or others reload the page
You can get a free trial period of 7 days allowing you to test the full version of the extension by following these steps :
- Click on “Trial version” link of Datama footer
- Click on “Upgrade”
- Create your Datama account
- Get your Trial extension with no engagement, and no credit card required
5. Getting started
Once you’ve imported the extension, here is how you can use it.
1. First think about your use case: You need first to consider which KPI you want to analyse and what are the steps that lead to the main KPI.
2. Prepare your dataset: 4 steps are needed to properly set your dataset.
- Main KPI: Define the main KPI you want to compare (e.g. Revenue, Leads, Margin…)
- Comparison Dimensions: Define on which elements you want to compare your KPI (e.g. Period: Compare Month over Month, Country: Compare one country to the other…)
- by default, Datama will select the first two elements of your dimension, or split a date range in two.
- Steps: Define the steps that correspond to the funnel that lead to your main KPI. For example (eCommerce funnel, or Finance funnel) See dataset examples
- To better define your steps (or metric equation), you can read our dedicated article.
- Explanation dimensions: Add Dimensions that will be used to explain the variations of your performance. Each variation will have an interest score to see how important they are to explain your variations.
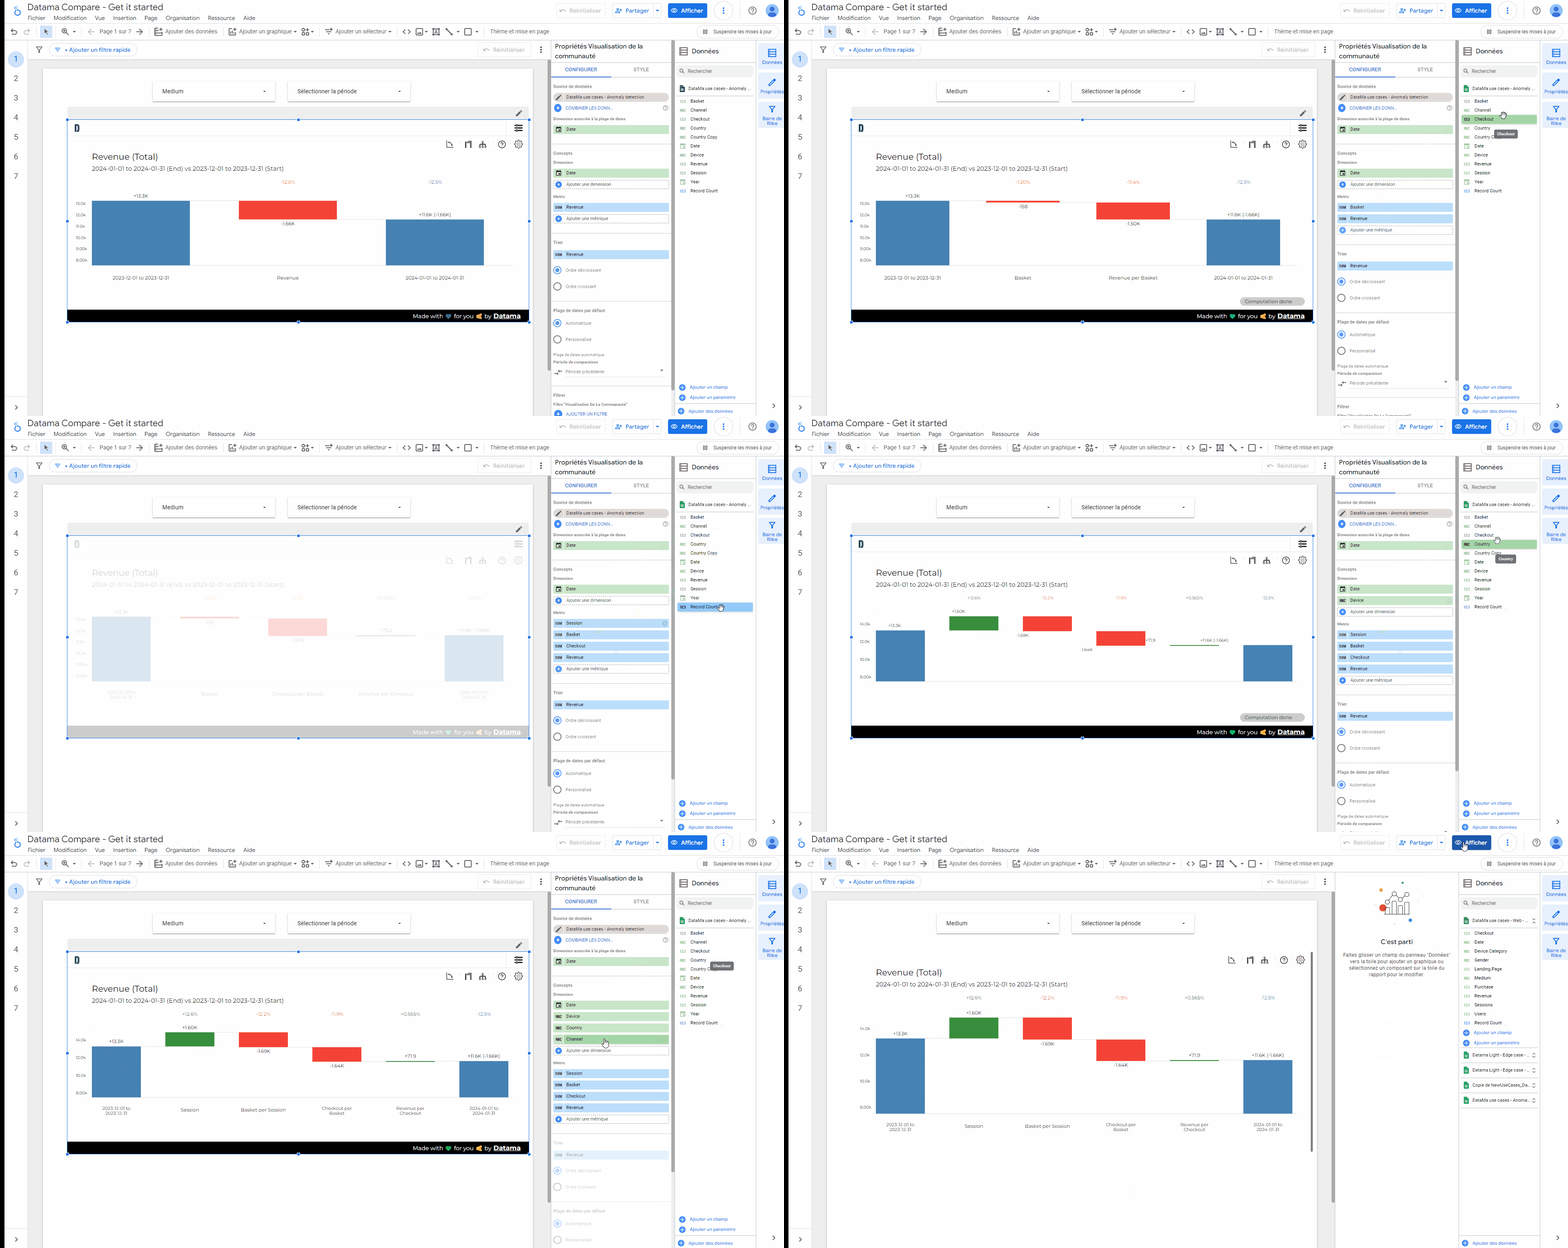
3. Custom settings: Open the side settings panel next to the chart (collapsed by default on Compare). Use the icon rail to jump between Comparison, Modeling, Market Equation, Chart, Colors, Waterfall, Tree, and Table. Analysis changes require Apply; chart and visual options update live.
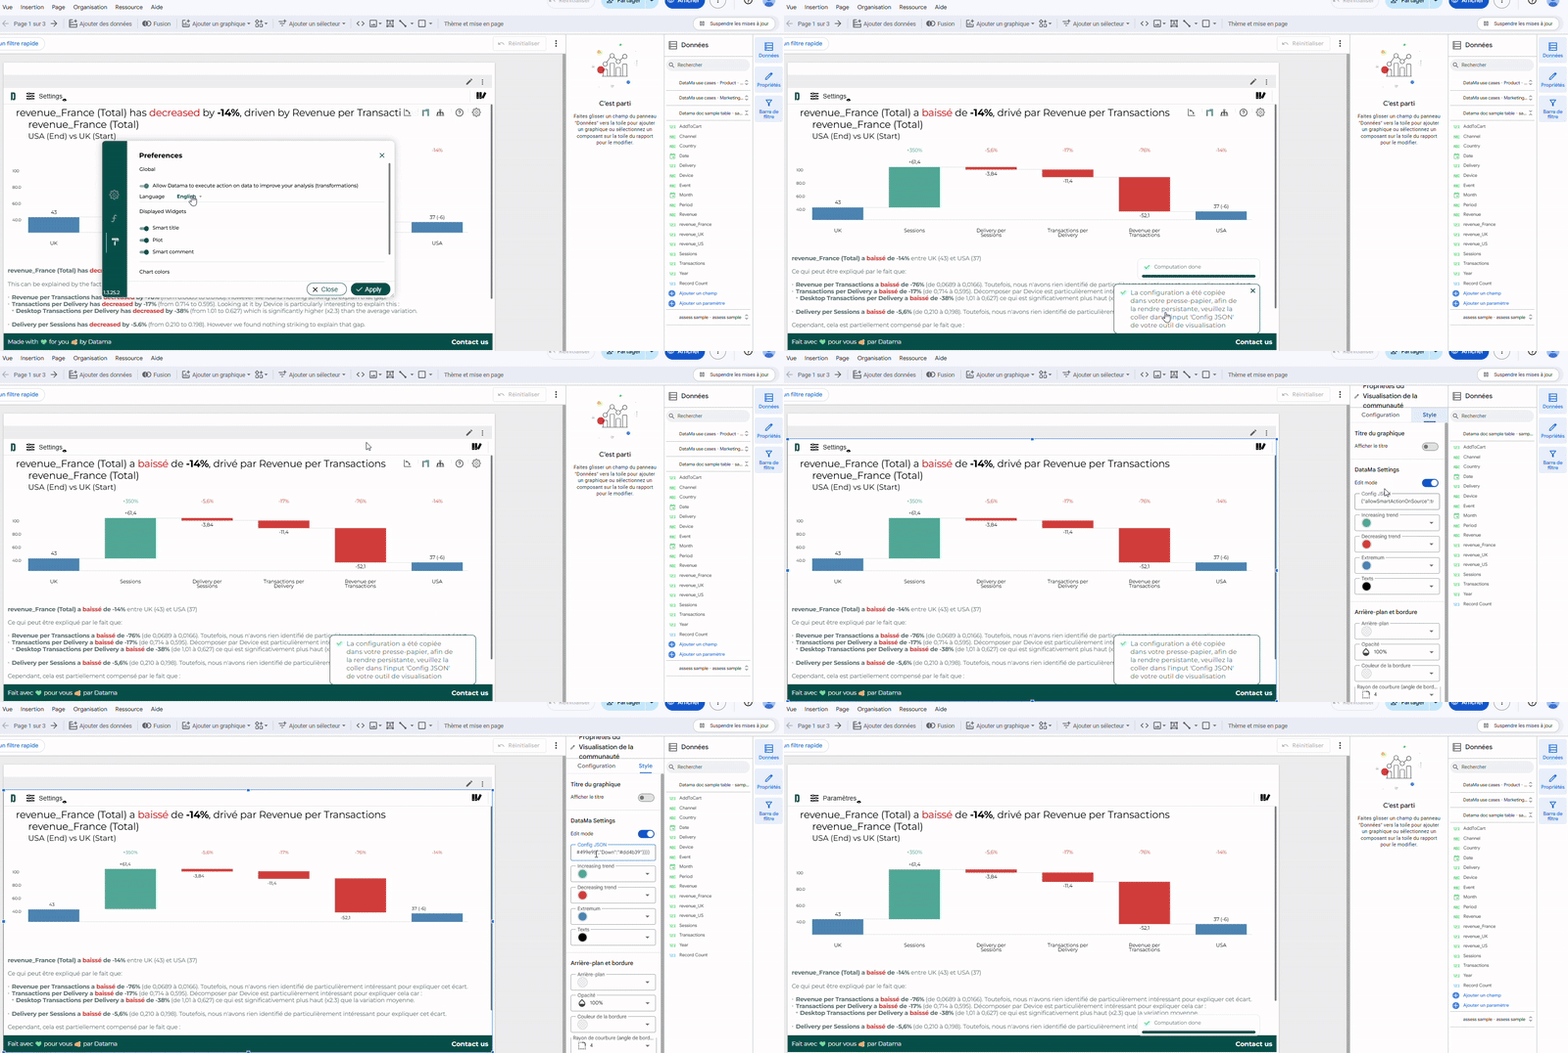
4. [Paid user only] Save settings: Once you’re satisfied with your settings, go to the Style tab in the Looker Studio side panel and paste the JSON automatically copied to your clipboard into the Config JSON field. If you’re unsure whether it’s the latest version, click the Save button in the top-right corner to generate the updated JSON, then paste it again into the Config JSON field. Please note that no customized settings will be saved unless you complete this step.
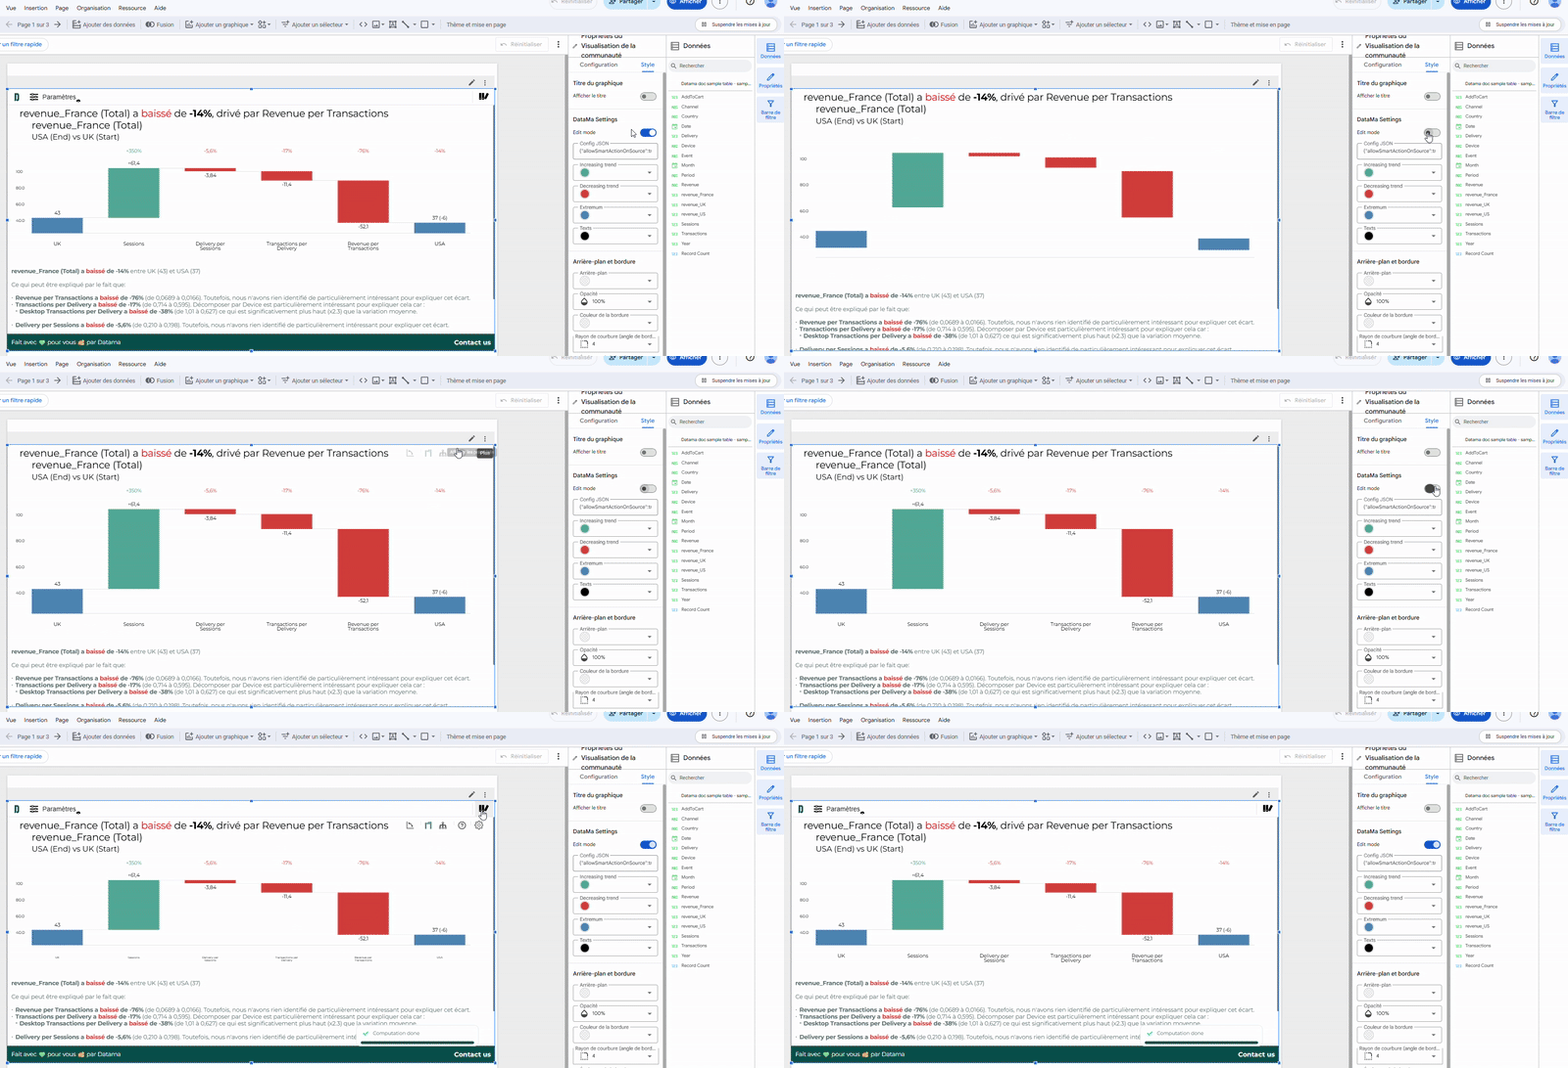
5. [Paid user only] Leave edit mode: In the Looker Studio side panel, in the “Style” tab, untick the “Edit mode” toggle. Dashboard viewers won’t see the top header and footer anymore, for a smoother experience.
6. Read your Analysis
- Performance Overview: Each blue bar represents the performance of your main KPI, using your chosen comparison dimension. helping you quickly gauge performance across different segments.
- Intermediary step analysis: Intermediary steps depict the ratio evolution of your KPI. The impact is quantified in the units of your main KPI, allowing for a consistent measurement of progress or regression.
- By default, the most interesting dimension will be selected for this zoomed step. Right-click a bar or a value / top-line label, then use Split by to change dimension. Drill up or click another step to leave the zoom. You can also pin Table / Tree views and add custom pillars from the context menu.
- In-Depth exploration: By interacting with a step—simply click on it—you’ll delve into the underlying dimensions that are most influential in explaining your performance variances at each stage of your funnel.
To discover more about how to read a Waterfall, you can read our dedicated section
7. Looker Studio Guide
Following this link you can access live demo of the extension on a real Looker Studio. Don’t hesitate to play with the extension with your own data. This is a free trial version with limited access.
Here is a free looker studio template with Google analytics source you can get for an overview of Datama extensions.
8. Advanced Usage
Follow this link to get the full view of the extension Settings available in this extension.
9. Get more insights
Explore related documentation to understand how to generate insights in Datama Compare
You can also see the demo here with Datama Compare and other available extensions in Looker studio connected to Google Analaytics source.
If you’re using Google Ads as a data source in Looker Studio, you can use this template right away.
10. Support and Resources
If you require assistance or have any questions, feel free to reach out. We’re here to help!
- 📧 Email: Send us an email at contact@datama.fr for any inquiries or support issues.
- 🌐 Contact Form: Prefer to use a form? Fill out our online contact form, and we’ll get back to you promptly.