Detect - Detection methods
Anomaly detection can be based on different methods available on the shelves in Datama Detect
Datama Detect is based on a method to spot anomalies called Observed volatilty.
1. Observed volatility
The observed volatility takes into account a baseline of X previous points (X can be defined in Number of points in baseline input) and computes the weighted standard deviation and average of that baseline for a given KPI to get a confidence interval based on normal distribution rules.
The confidence interval is in light blue. Points outside the confidence interval will be considered as anomalies.
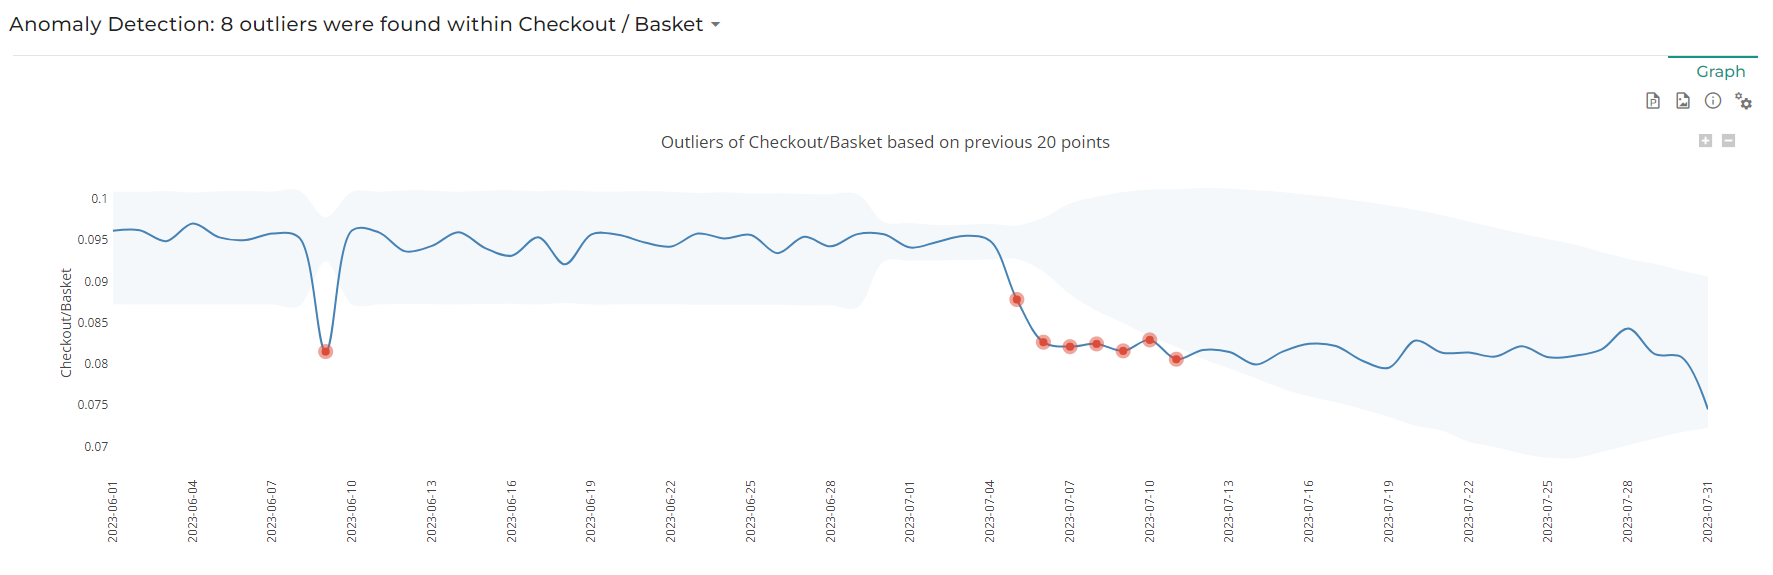
In the above screenshot, note that the number of points in baseline is set to 20, which is obvious for instance when looking as the spike of the 9th of June impact makes the confidence interval narrow down starting on the 29th of June, i.e. 20 days later.
Details of the settings are available in the dedicated page