New feature in the redesign Compare 09-2026
This page highlights the main new capabilities of Datama Compare, grouped by algorithm, display, and UI / UX.
For detailed controls, see Settings.
1. Algorithm
1.1. Dimensions then Steps or Dimensions
Under Modeling › Analysis method, choose how the waterfall explores your data:
| Method | Behavior |
|---|---|
| Auto (default) | Computes both approaches and shows the most interesting one |
| Steps then Dimensions | Starts from market-equation steps, then drills into dimensions |
| Dimensions then Steps or Dimensions | Starts from the strongest dimension, then explores that segment via steps or another dimension |
Dimensions then Steps is especially useful when the first question is which segment moved? before which KPI step moved?.
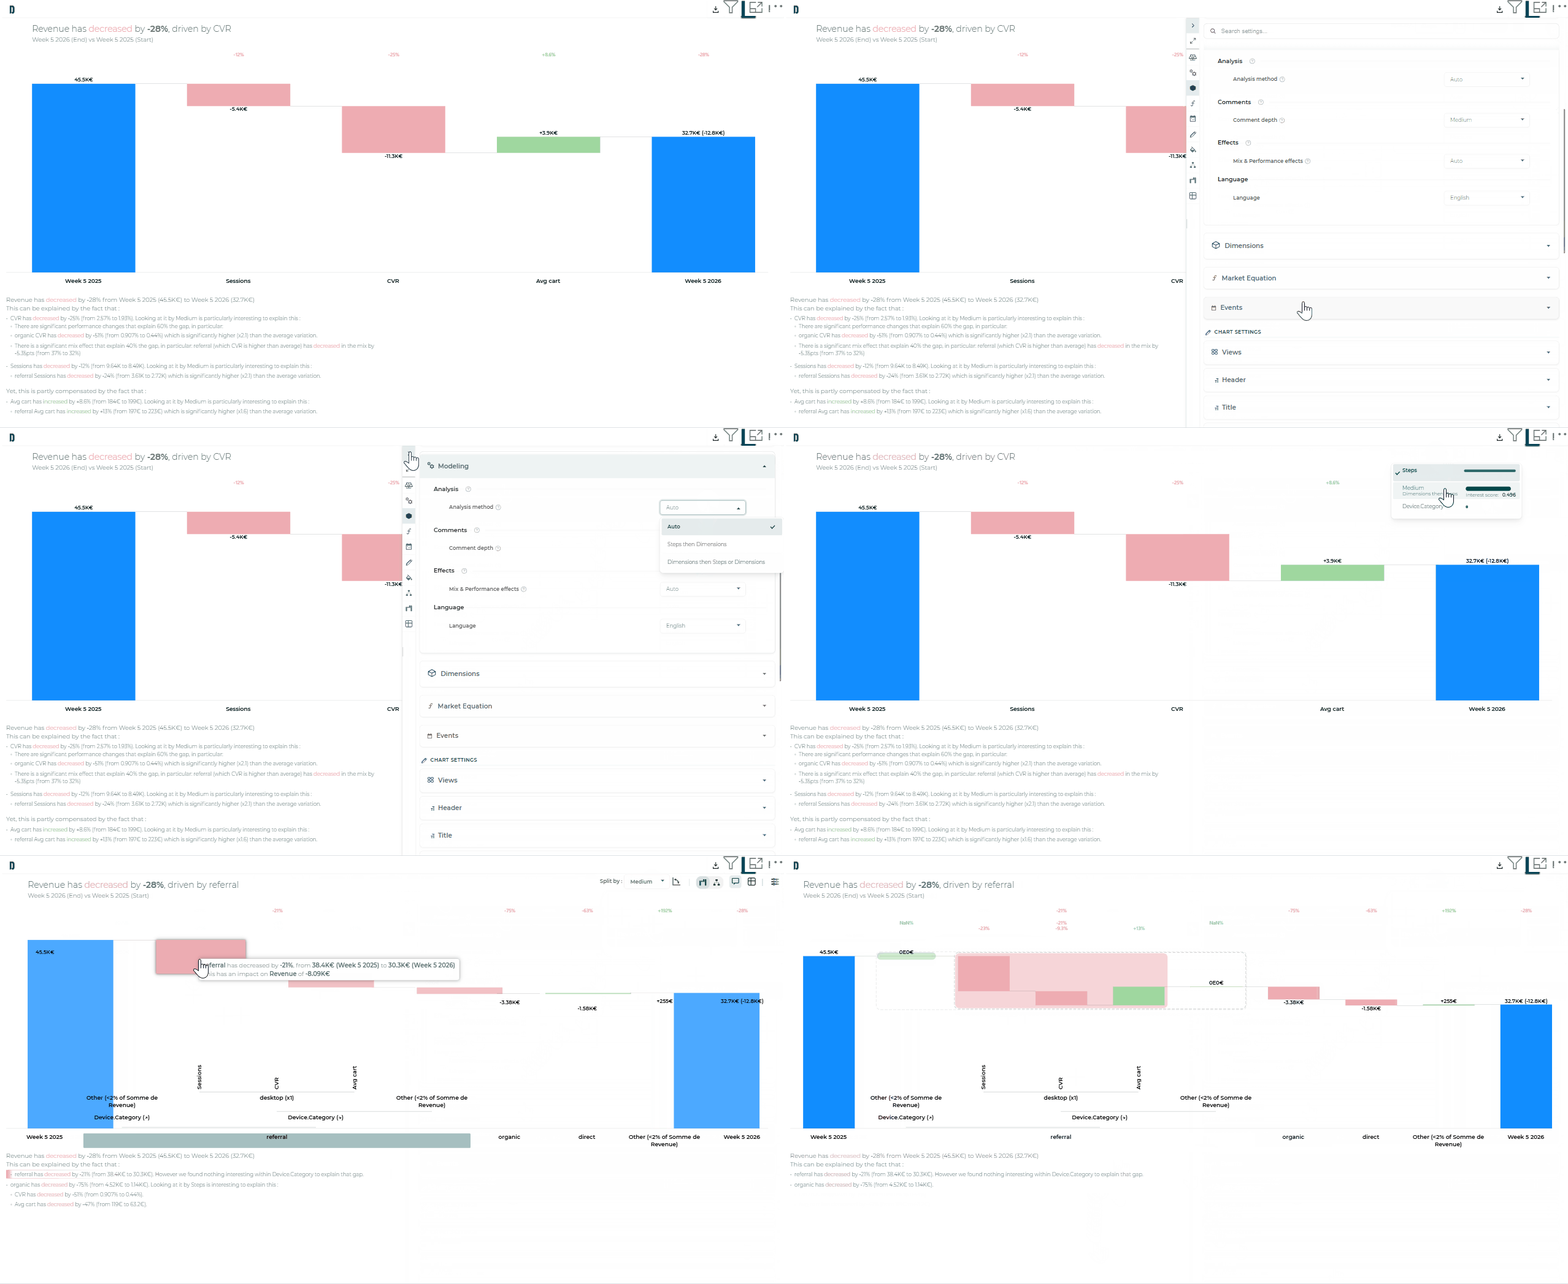
See Settings › Modeling › Analysis method.
Infinite drill-down
Infinite drill-down applies when you are on Dimensions then Steps or Dimensions and keep exploring via Split by on dimensions. From that point, you can keep splitting into further dimensions without a fixed depth limit.
- Open a dimension on the waterfall, then Split by a dimension
- Continue drilling into other dimensions as deep as your data allows
- Drill into / drill up stay fluid (bars morph in place)
- Smart title, subtitle, and comment follow the active split
Limits apply when:
- Your market equation is simple (sum of the steps or product of the steps)
- Your market equation is complex (with different operators) and you provide a column that matches the results of the market equation (this column should not be used in the market equation but be provided in the metrics fields of your extension)
And when a step block is open, infinite drill-down stops.
1.2. Dimension hierarchy
When dimensions have a natural order (e.g. Country → Region → City, or Universe → Family → Product), define a hierarchy in Dimensions settings.
Datama then:
- Opens on the most relevant level 0 dimension by default
- Lets you drill down (or filter) into deeper levels
- Lets you pin a dimension as the priority driver of the analysis
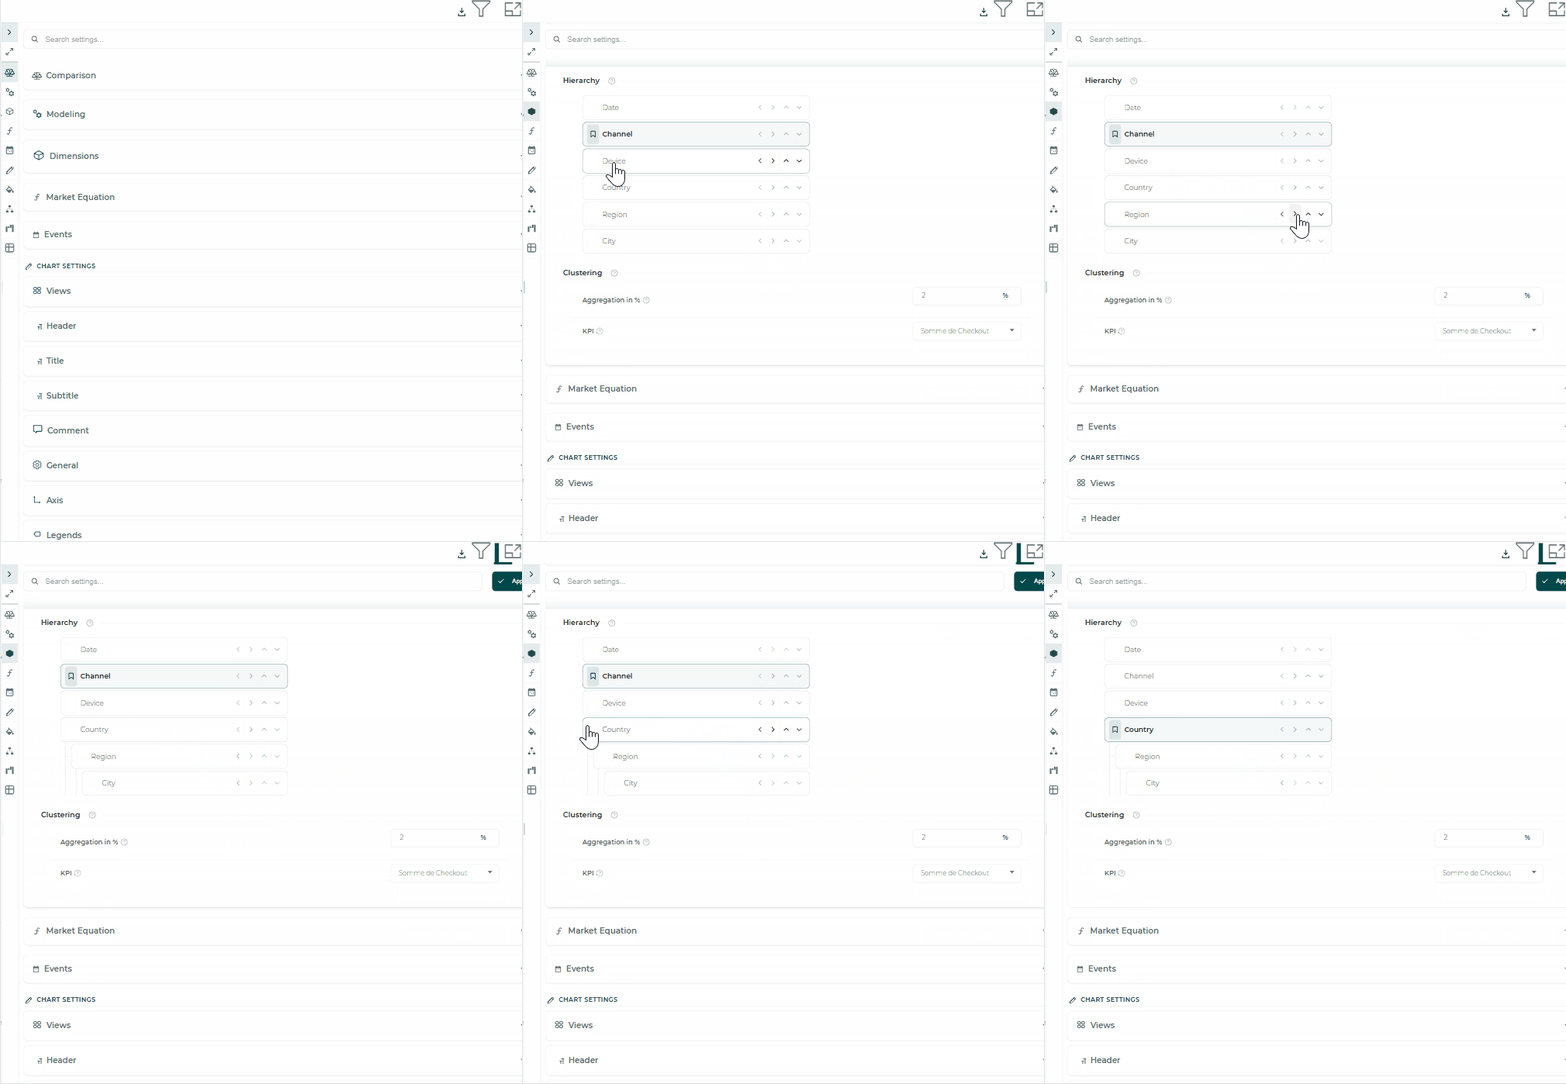
See Settings › Dimensions › Hierarchy.
2. Display
2.1. Table
The Table view is available as a pinned surface next to the waterfall. It is fully configurable in Settings (columns, sort, pagination, colorized values) and stays interactive with the waterfall: drill-down opens the same branches on both sides, and hover highlights the matching rows and bars.
You can also copy the table as CSV by clicking the small copy icon at the top left of the table, to reuse the data in Excel, Sheets, or another tool without leaving the widget.
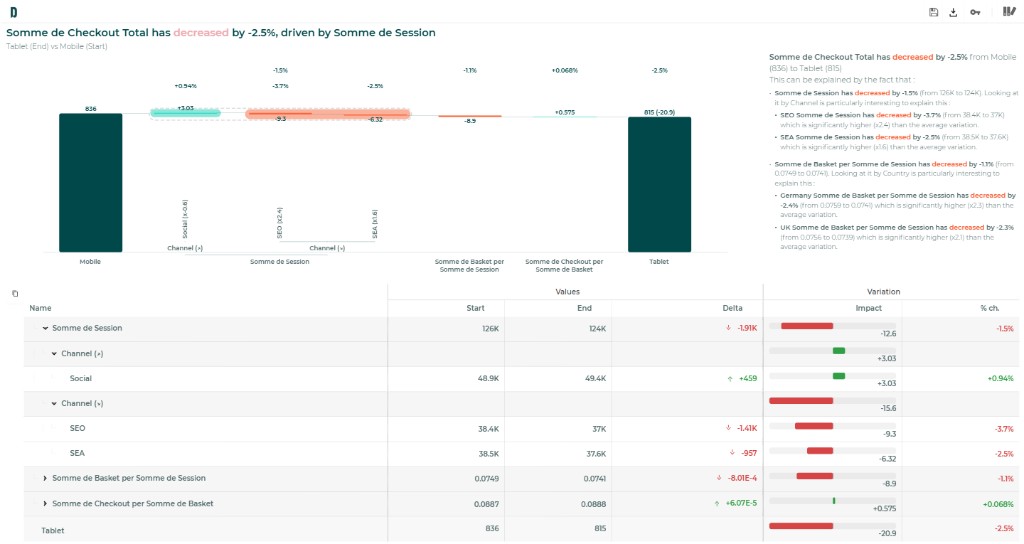
See Settings › Table.
2.2. Sub-pillars
Insert synthetic net checkpoints on the waterfall (e.g. “After mix”, “After price”).
- Right-click a bar → Add pillar (before / after)
- Name the checkpoint and choose the impact reference (vs previous net or vs Start)
- Pillars use End-style labels (e.g.
1.2M€ (+120k€)) - Edit them later under Waterfall › Elements › Pillars
- To remove one, right-click the added pillar and choose Remove pillar
Useful to stage the story of the variation without changing the underlying market equation.
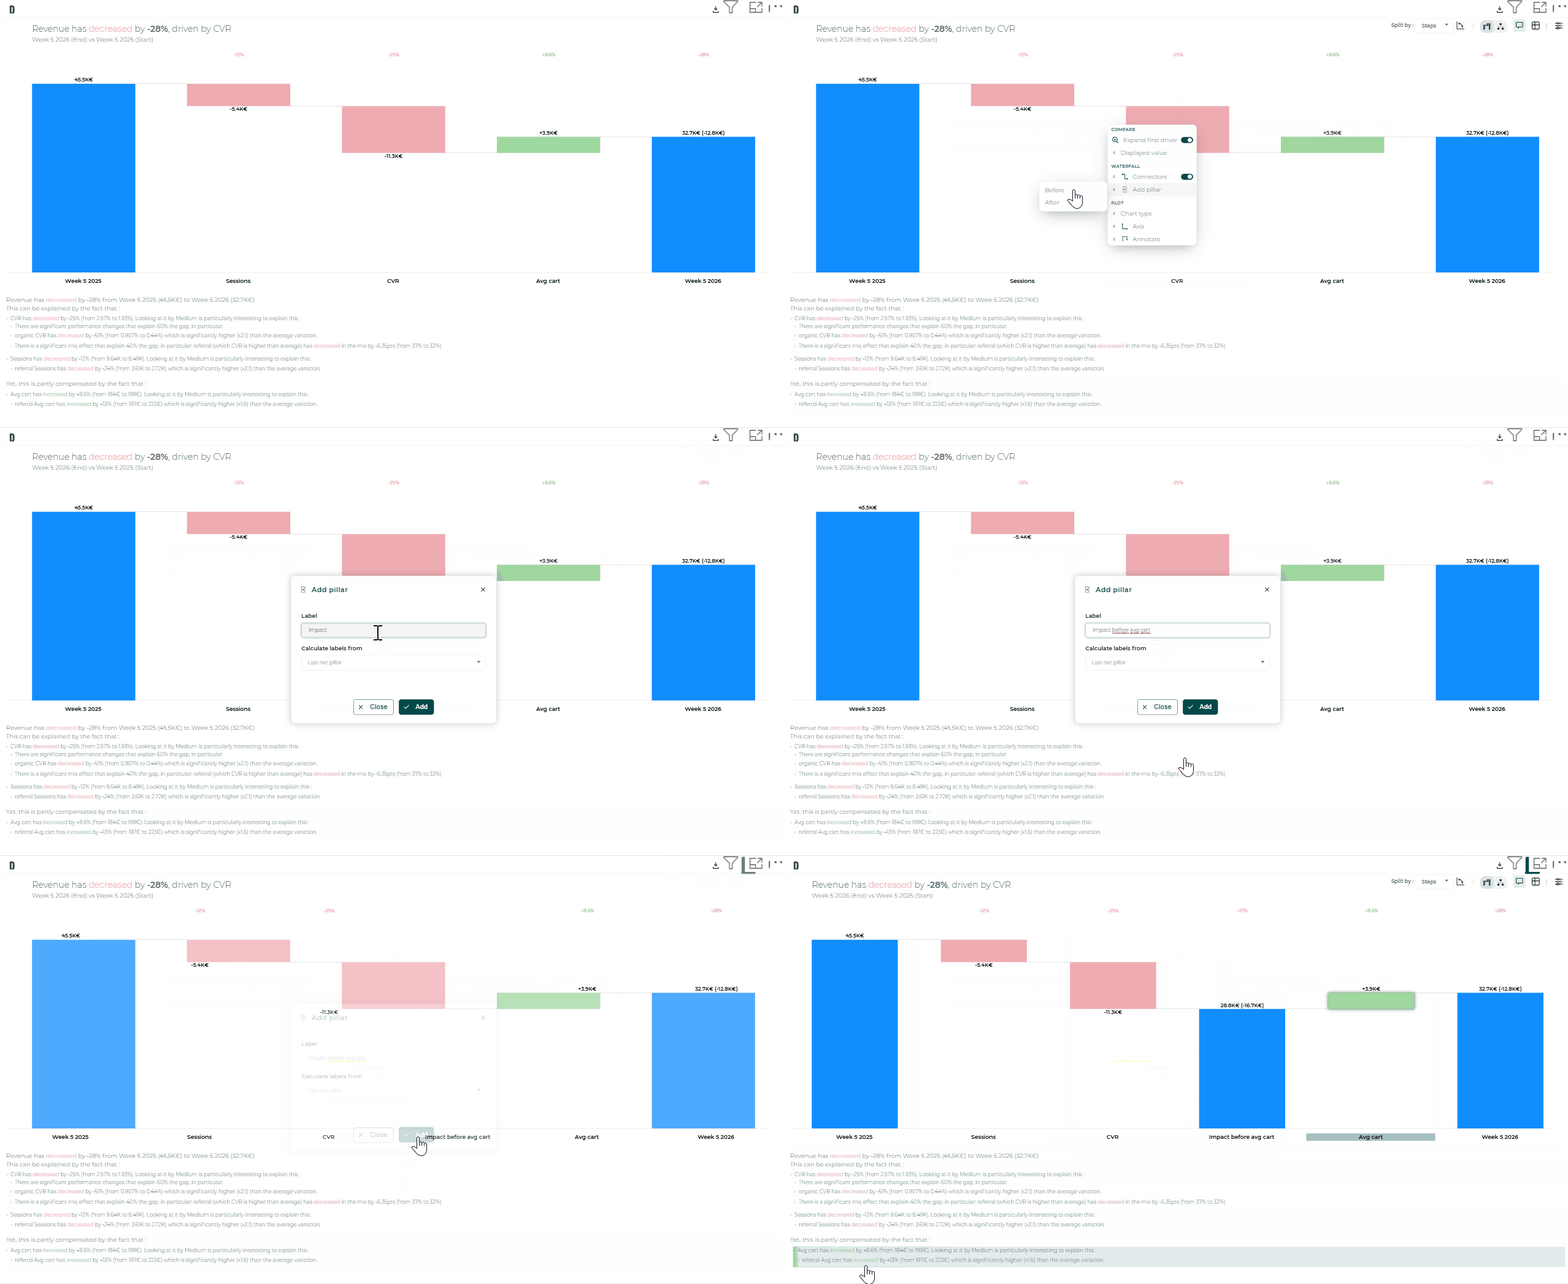
See Settings › Waterfall › Pillars and the Context menu.
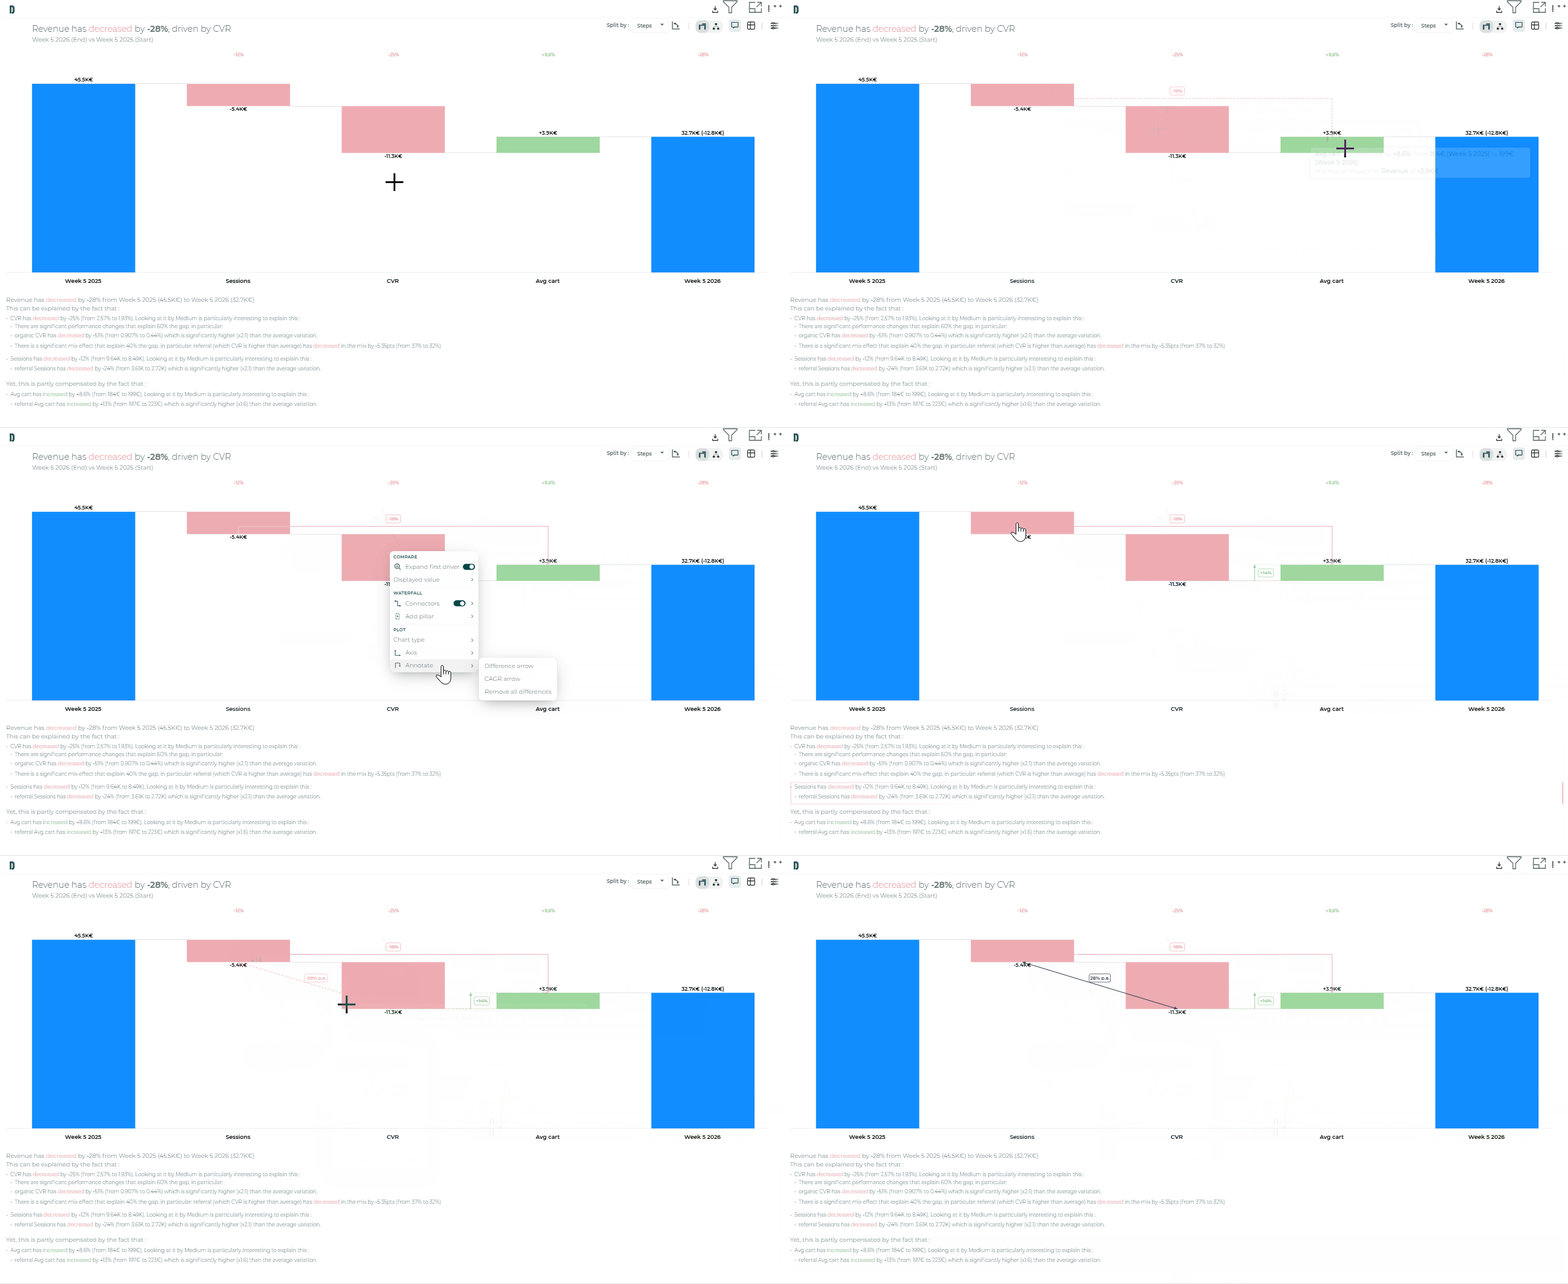
2.3. Difference arrows (annotations)
From the context menu (Annotate › Difference arrow), add think-cell–style arrows between two bars to highlight a gap:
- Level difference between adjacent elements
- Total difference across a range of steps
- Optional CAGR-style growth arrow
Arrows stay anchored to the data (not to pixels), so they survive drill, reverse axis, and layout changes. Hover an arrow to see the calculation detail.
Once an arrow is placed, you can edit it directly on the chart:
- Click the line: cycle through the three style presets
- Click the label: switch the displayed value between % change, impact in points, and both
3. UI / UX
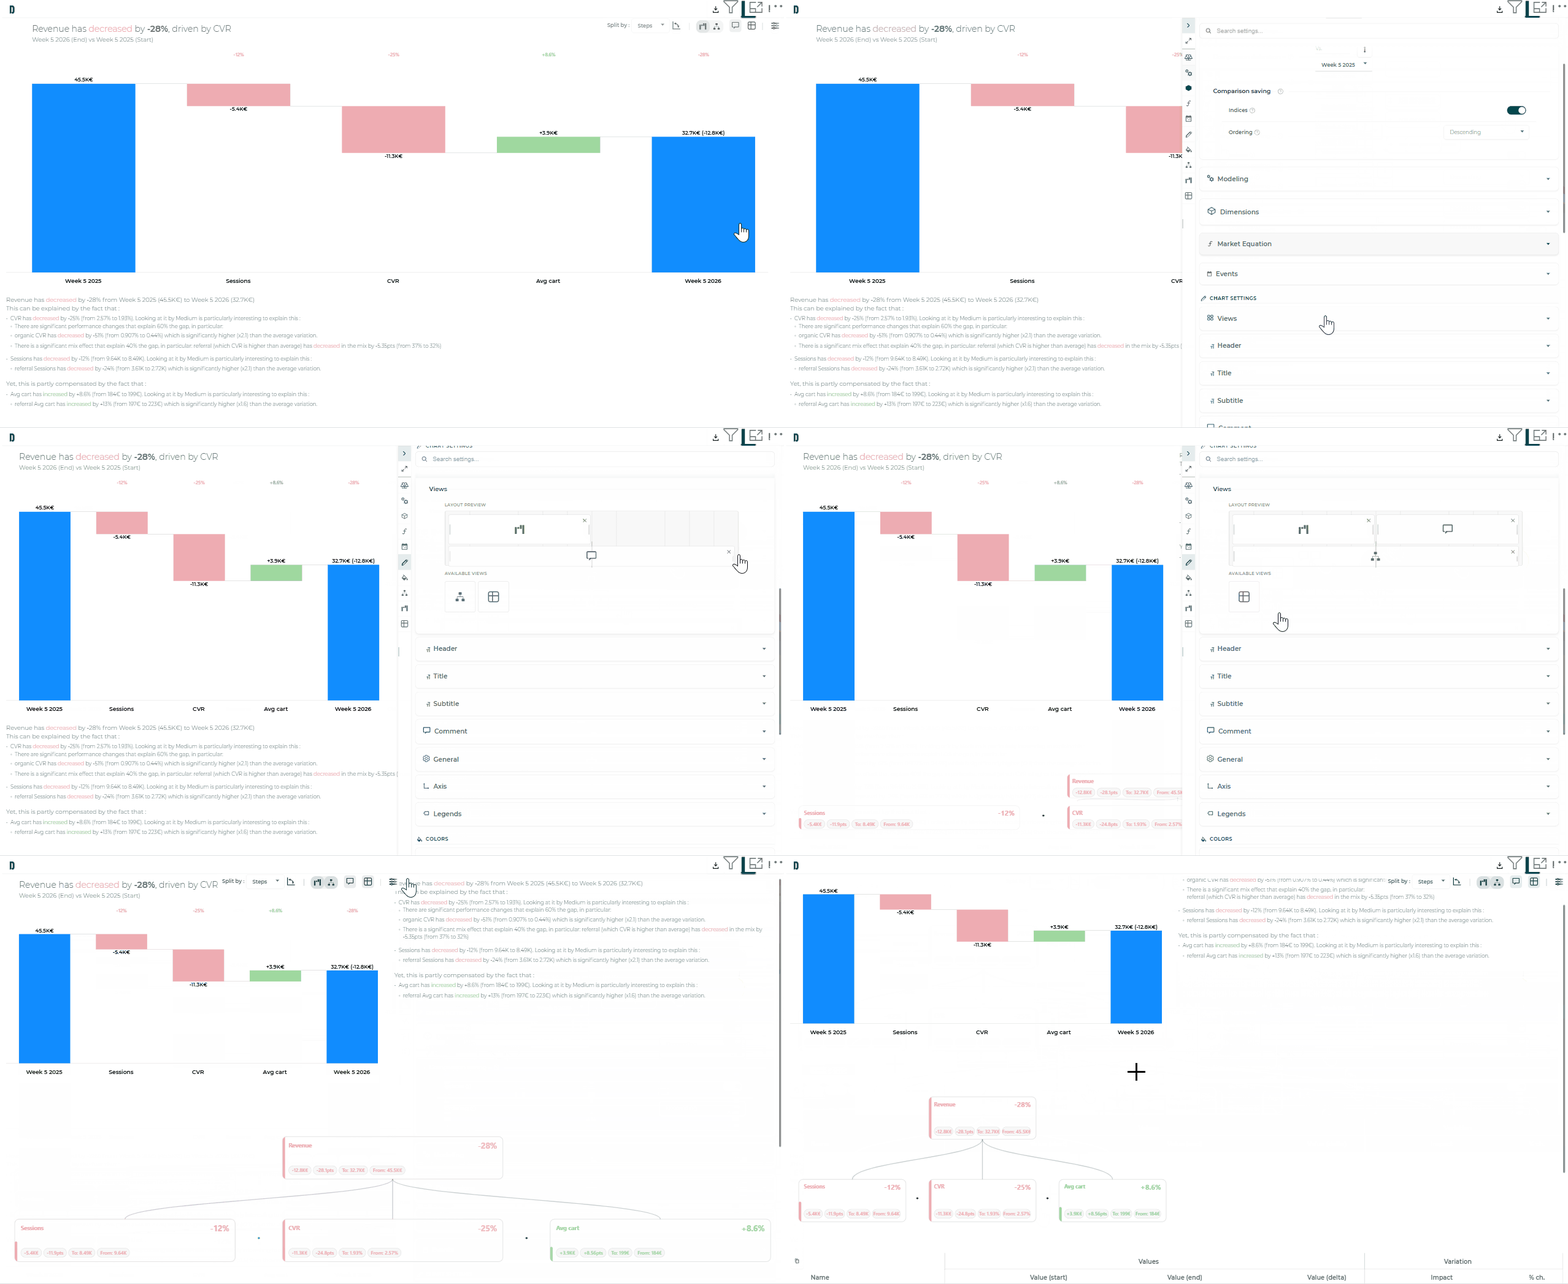
3.1. Multiple views and slide organisation
Compare is built as a workspace, not a single chart.
From Chart › Views, you can pin and arrange several surfaces side by side:
| View | Role |
|---|---|
| Waterfall | Bridge chart explaining the variation |
| Comment | Smart narrative next to the insight |
| Tree | Card hierarchy of the same drivers |
| Table | Hierarchical numbers aligned with the chart |
Resize panes in the layout preview, pin or unpin views, and keep everything in sync when you drill or Split by.
3.2. Context menu (right-click)
Right-click a bar, a value label, or a top-line label to open the context menu. The same actions are available from all three targets.
All labels on the waterfall are editable from this menu, so you can adjust display options directly on the chart without opening the full settings panel (value labels, top-line labels, connectors, and related styling).
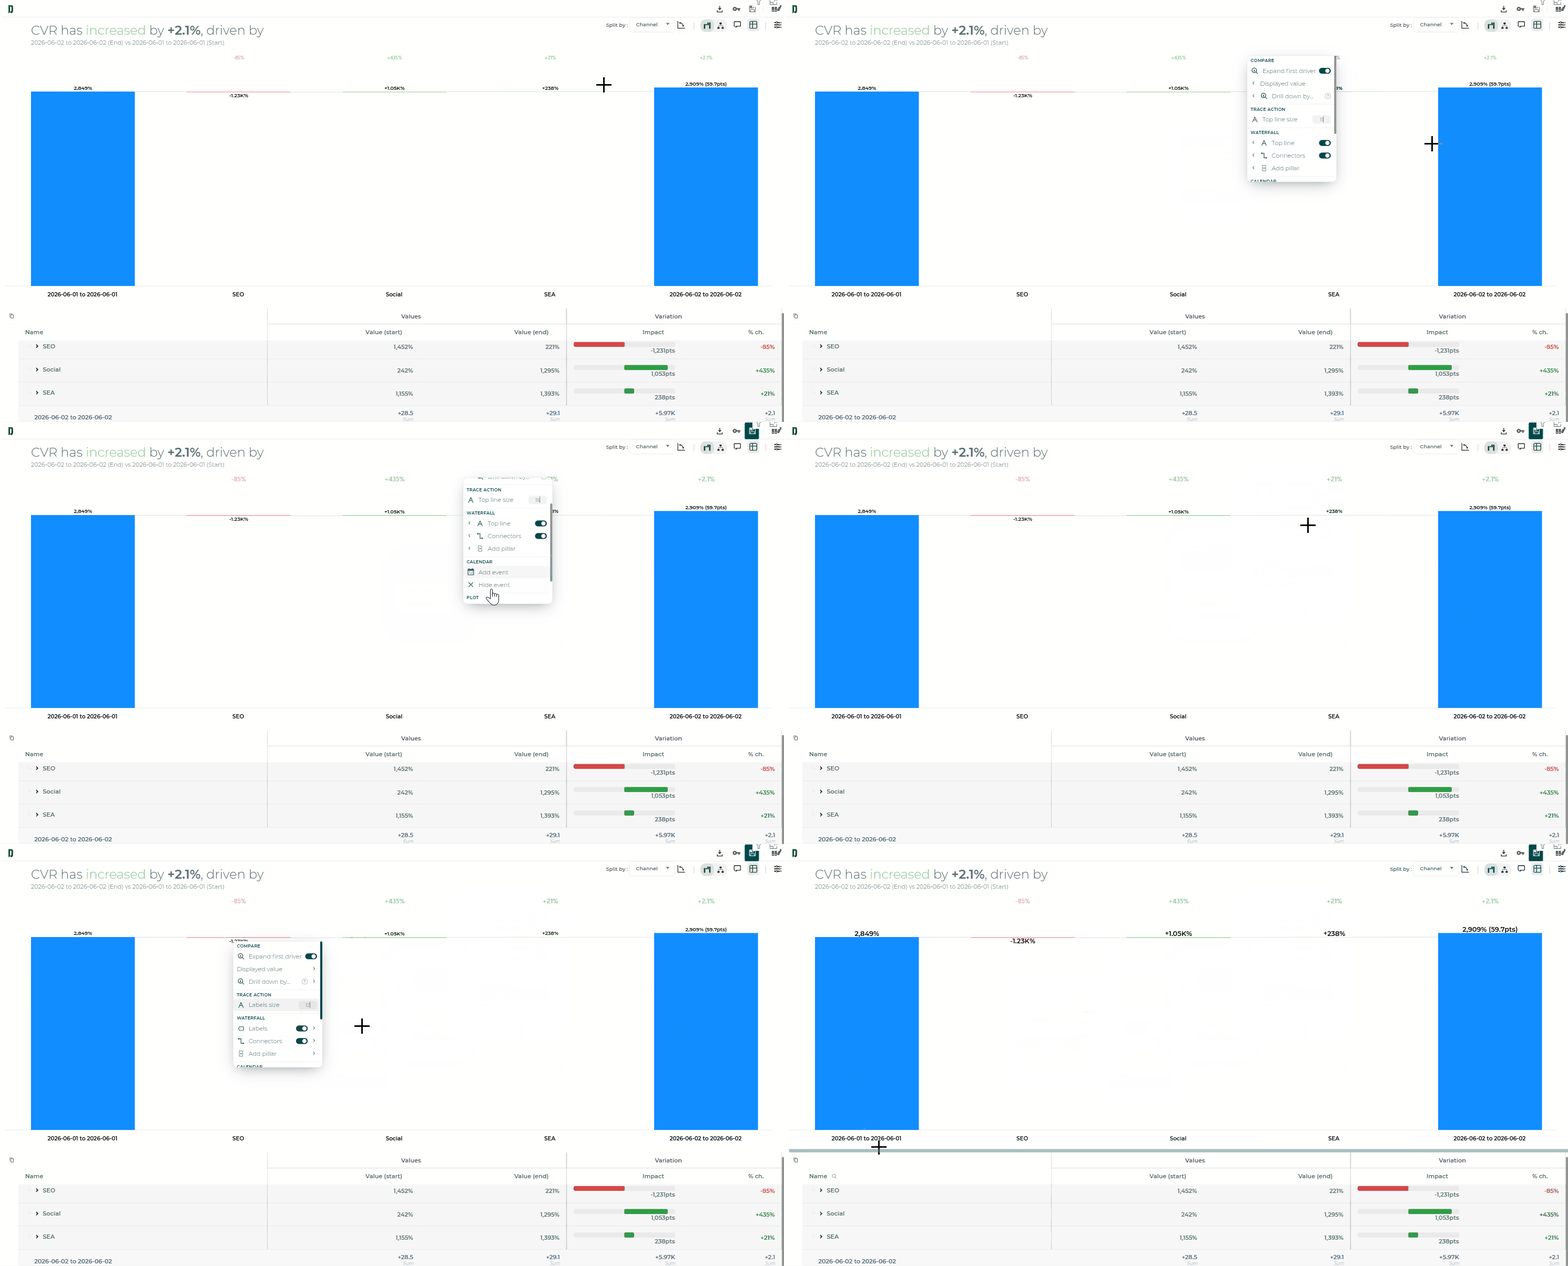
See Context menu.
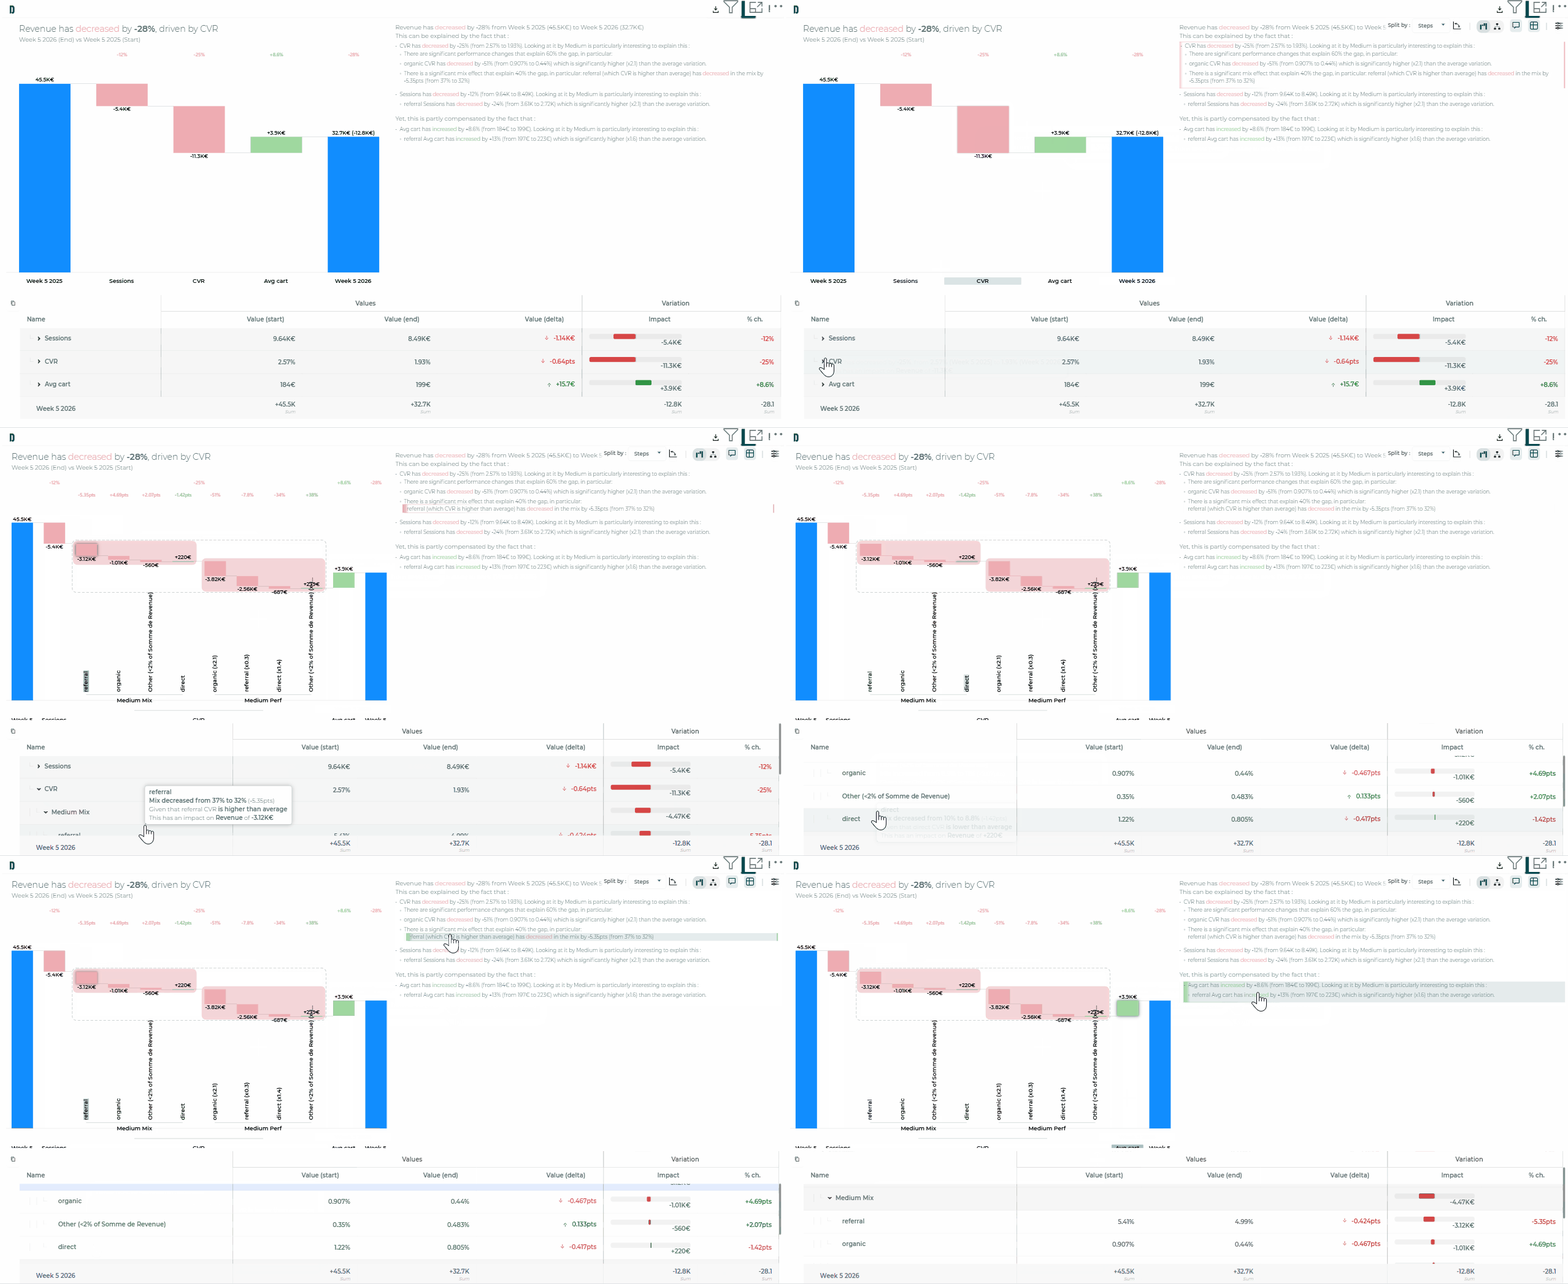
3.3. Interactivity between the views
When several views are pinned, they stay in sync:
- Hover: hovering an element highlights the matching rows / cards / bars / comment lines across Waterfall, Comment, Table, and Tree
- Drill and Split by: a drill-down, drill-up, or Split by performed in one chart is reflected in all other pinned views
This makes it easier to follow the same driver across surfaces and keep the narrative aligned with the numbers.
A shortcut bar also appears on chart hover and stays out of the way otherwise (Split by, Reverse axis, Waterfall / Tree toggle, Comment, Table, Settings).
See Shortcuts on hover.
3.4. Settings panel
Settings live in a side panel next to the chart. The panel starts collapsed to leave more room for the visualization.
- Icon rail: jump between Comparison, Modeling, Market Equation, Chart, Colors, Waterfall, Tree, Table
- Apply: batch equation / modeling / comparison changes, then recompute once
- Live: Chart, Colors, Waterfall, Tree, and Table tweaks apply immediately
- Search: find options faster in a dense panel
- Tooltips: explain advanced options on controls
For detailed options, see the Settings guide.
3.5. Operators (available on Tree only)
Equation operators (×, ÷, +, …) can be shown on the Tree view to make the market-equation logic visible between cards, not only in settings.
Configure them under Tree › Operators.
See Settings › Tree › Operators.
3.6. Emoji (available on Tree only)
Assign an emoji to each step of the market equation. In Tree view, these emojis appear on the corresponding cards so you can spot drivers at a glance in the hierarchy.
Configure the emoji column under Market Equation, then Apply. The enrichment is visible on Tree cards only.
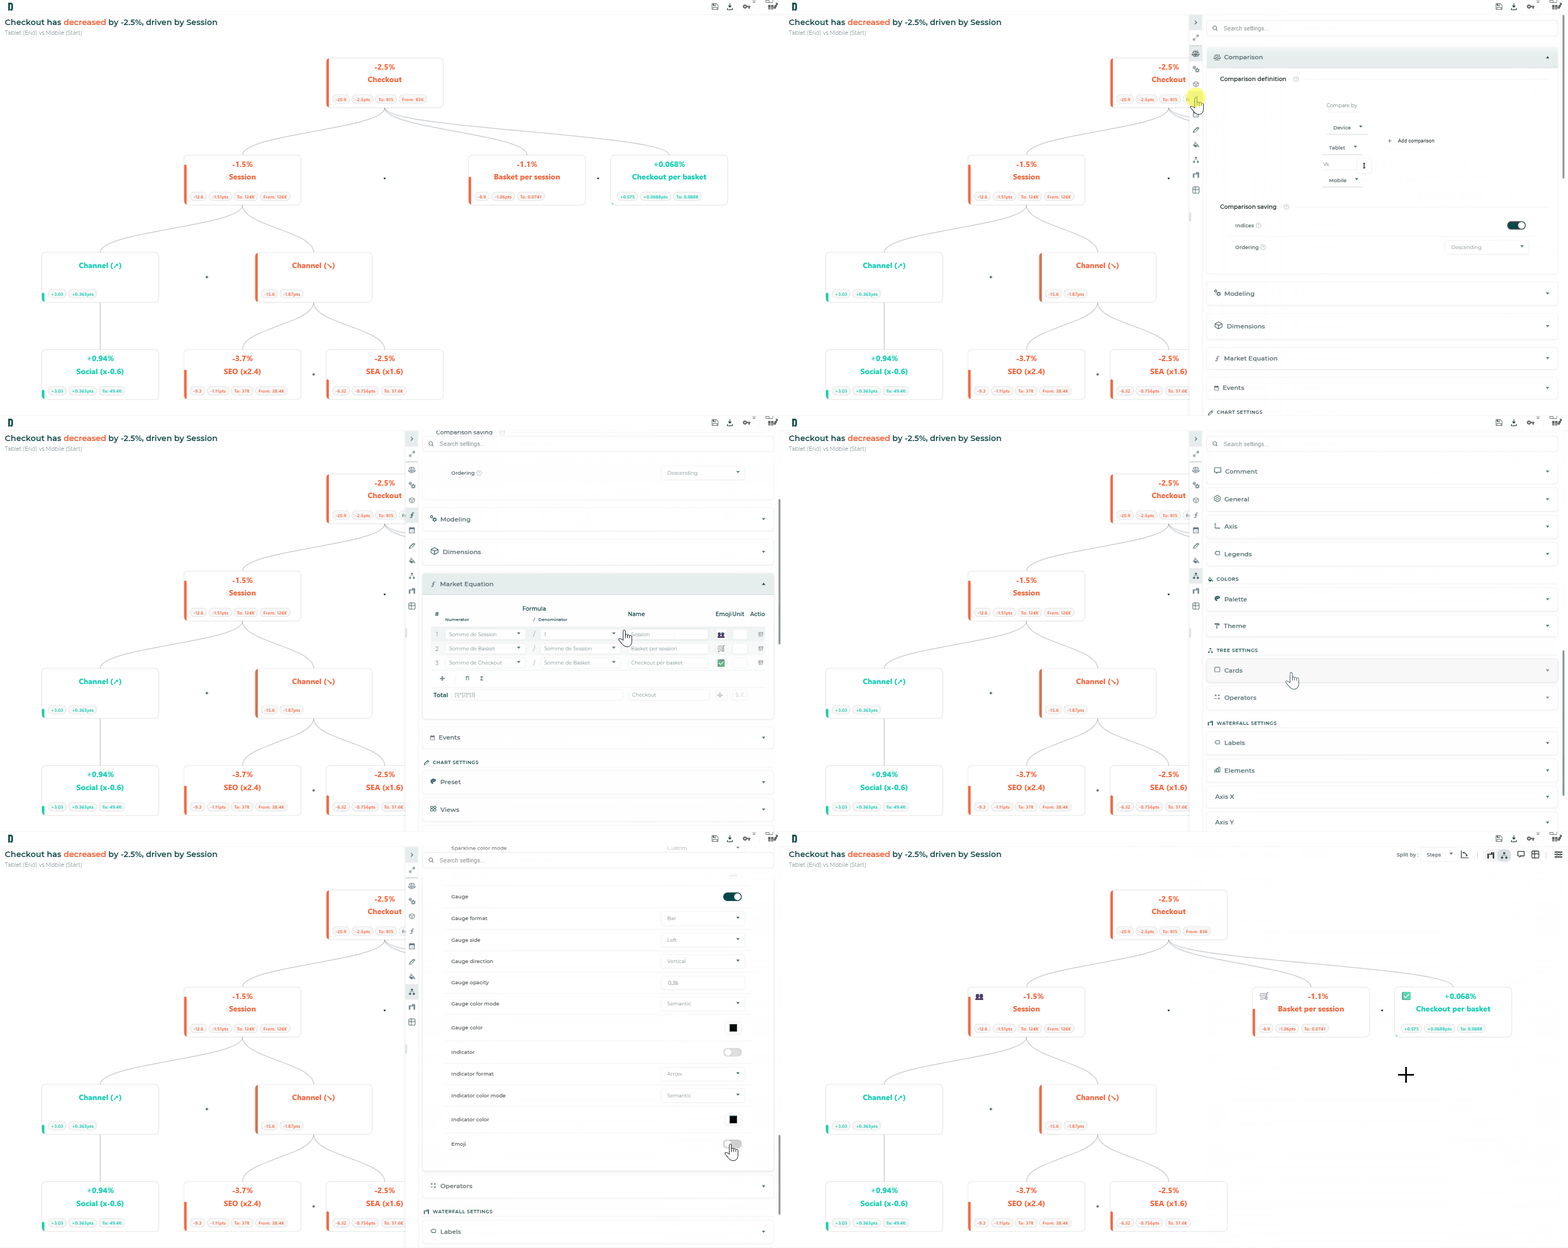
See Settings › Market Equation.
3.7. Keyboard shortcuts
| Shortcut | Action |
|---|---|
| Shift + R | Reverse the axes of the Waterfall and / or the Tree |
| Shift + W | Switch to the Waterfall view |
| Shift + T | Switch from the Waterfall to the Tree |
| Shift + S | Open the settings panel and focus the search |
4. Related documentation
| Topic | Page |
|---|---|
| What If scenarios | What If in Datama Light |
| Market equation Sub-steps | Sub-steps guide |
| Covariance controls & Remaining ranking | Settings › Modeling › Covariance · Items displayed |