Power BI - marketplace extension
Welcome to the Datama extension documentation for Power BI. Harness the combined strengths of Datama and Power BI to make your reports more insightful.
1. Why I am here?
This document provides detailed documentation for the “Datama Compare - What’s driving my variation” Plugin, a powerful extension for Power BI. This plugin enhances data analysis capabilities by explaining performance variations with easy to understand data visualization graph.
To get a clearer understanding of the concept of this “Compare” extension does, visit this page.
Watch this video to properly understand our extension and how to use it.
2. What use cases can the Demo handle?
We’ve preloaded several datasets for you, but you’re welcome to add your own dataset:
- Web Analytics: Funnel conversion analysis highlighting variations between Last Year and This Year.
- Retail Performance: Compare the net margin on a month-over-month basis.
- Media Acquisition: Assess the effectiveness of campaigns over time including performance of media budget allocation.
- Product A/B Test: Evaluate performance variations in the conversion funnel for Variant versus Control in A/B Tests.
Load your own data if you want to test the extension even further!
3. Setting up the Datama extension
- Download the extension: Download the latest Datama PowerBI extension
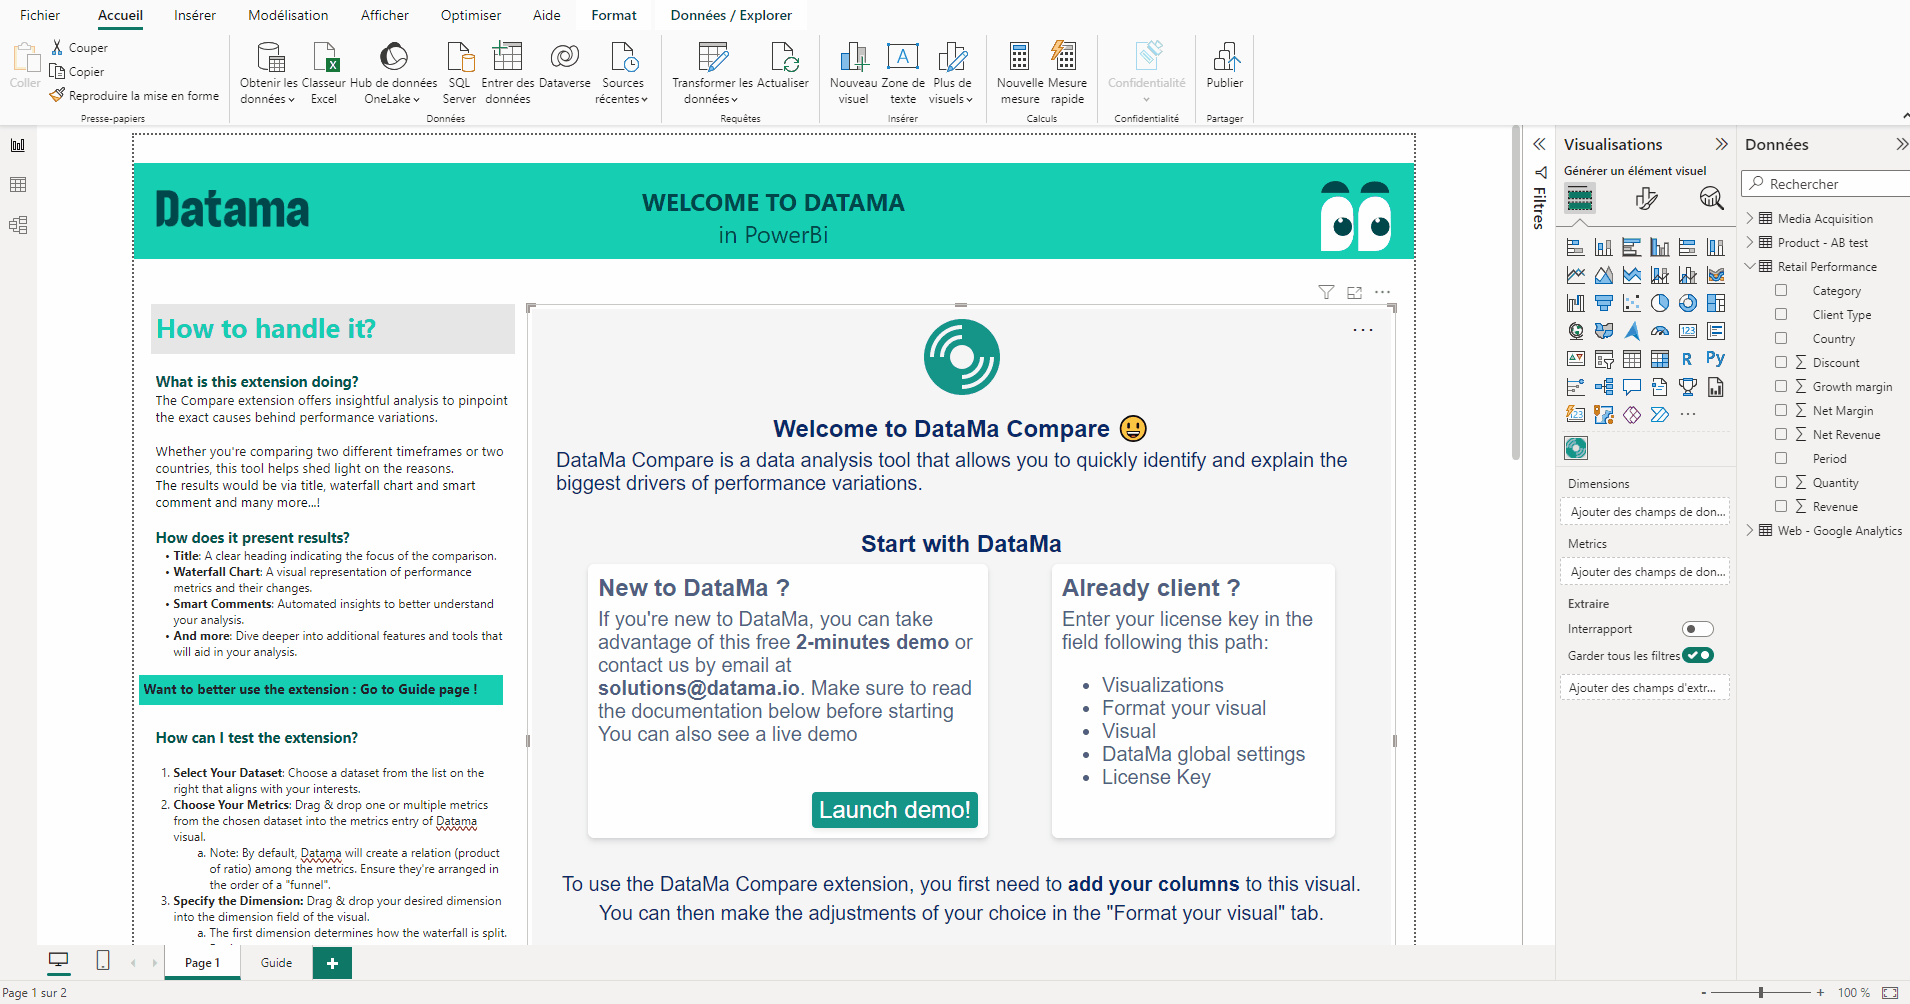
- Select Your Dataset: Pick from the list on the right a dataset that meets your interests.
- Choose Your Metrics: Drag and drop desired metrics from the dataset into the Datama visual metrics entry.
- Note: Datama sets up a relation (product of ratio) among metrics by default. Ensure they’re in a “funnel” sequence.
- Specify the Dimension: Drag and drop the dimension of your choice into the visual’s dimension field.
- The first dimension is the one used for comparison. For example:
- Dates lead Datama to split the period in two.
- Lengthy lists use only the last two items.
- Adjust your comparison with filters. For complex dimensions, establish a calculated field.
- The additional dimensions refine our scoring algorithm to pinpoint the most relevant dimension for performance variations in your funnel.
- The first dimension is the one used for comparison. For example:
- Launch and Learn: Post configuration, hit “Launch demo” for a 2-minute interactive tour. For a deeper dive, connect with us at solutions@datama.io.
4. Want more insight into the solution?
If “Mix effect”, “Performance effect”, or “Market Equation” sound intricate, explore our dedicated pages:
- Mix effect
- Performance effect
- Market Equation (or Metric Relation)
Reach out to us at solutions@Datama.io for further testing or to inquire about licensing options.