Datama Compare
Datama Compare is an advanced analysis tool that quickly and accurately identifies the factors driving changes in your performance indicators.
With an automated and actionable approach, Datama Compare makes it easy to analyze KPI variations between two segments—whether comparing time periods, acquisition channels, audiences, or any other strategic dimension.
This documentation provides an overview of how Datama Compare works and guides you through its use to generate clear, data-driven insights.
1. What we are trying to answer?
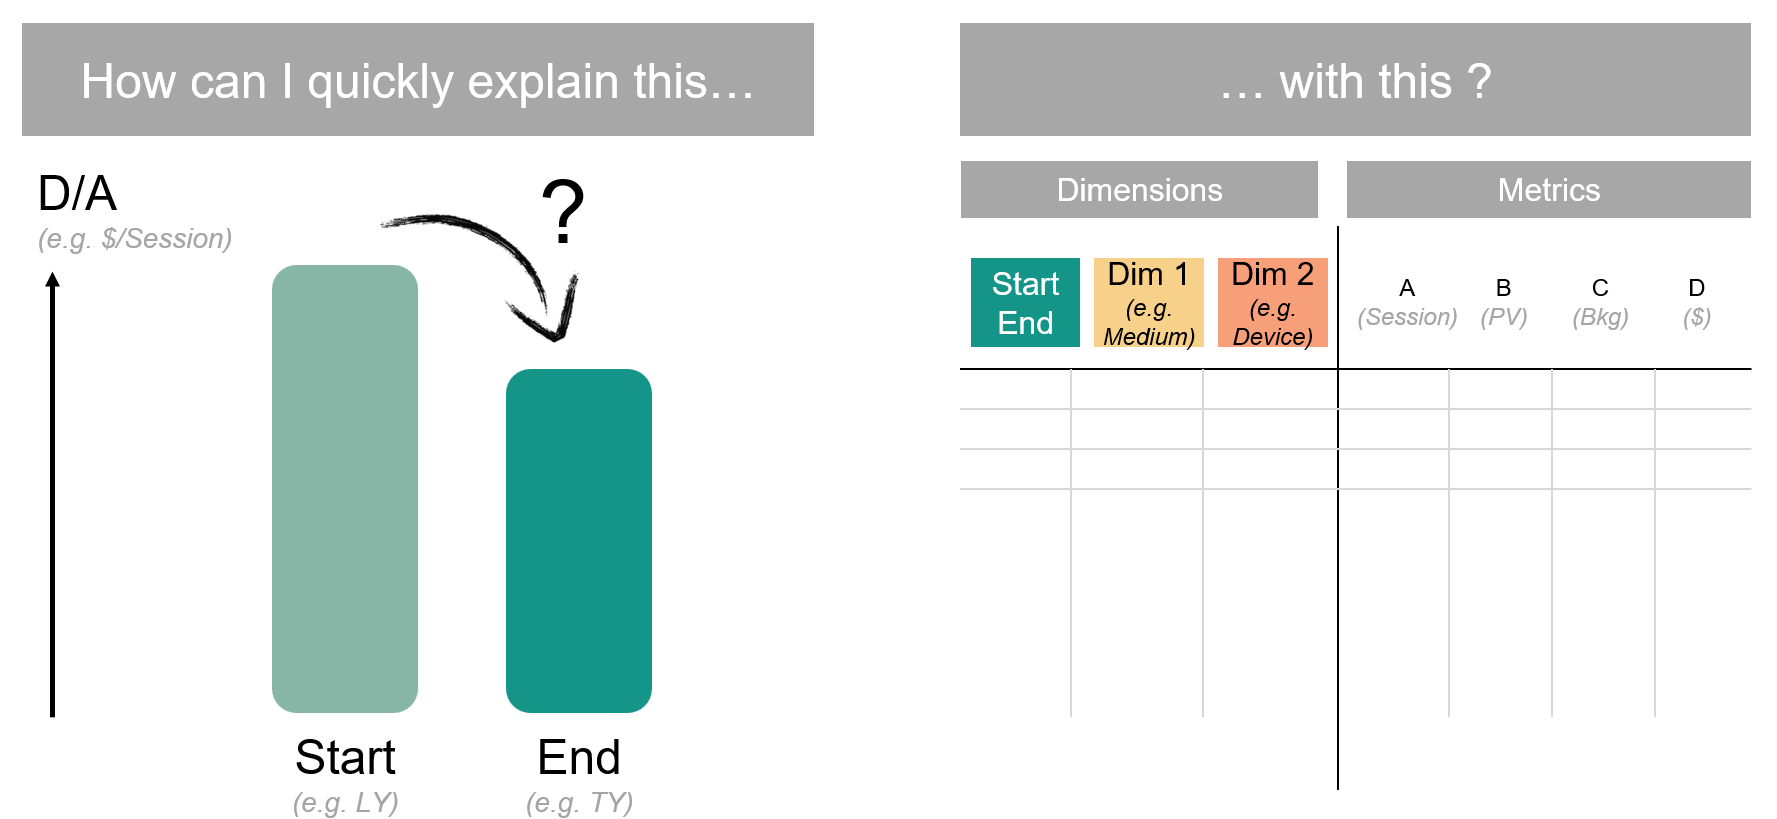
This analysis is powered by two key data components collected from your business:
- Business Metrics – Core performance indicators such as revenue, sales volume, number of users impacted by a marketing campaign, and other key figures that define your success.
- Associated Dimensions – The contextual attributes that help break down and explain these metrics, such as customer segment, product type, country, vendor, age, gender, device, year, model, and more.
Datama Compare works with first-party data collected directly by your company, whether from your ERP, spreadsheets, or analytics tools like Google Analytics, ContentSquare, and others. It can also integrate third-party data from external sources, such as market reports or public datasets, to enrich the analysis and provide a broader perspective.
Here are the subsections you will find in this chapter:
-
Concept: discover the key principles of Datama Compare and how they apply to business use cases.
-
Model: explore the model structure and its components (covariance, mix, performance, etc.).
Follow this link, to get access to a more commercial presentation.
Hope you enjoy it.
Please feel free to send any feedback and do not hesitate to reach us if you have any question about the solution, your analysis or the documentation. We will be more than happy to get your point of view.