Assess - General Introduction
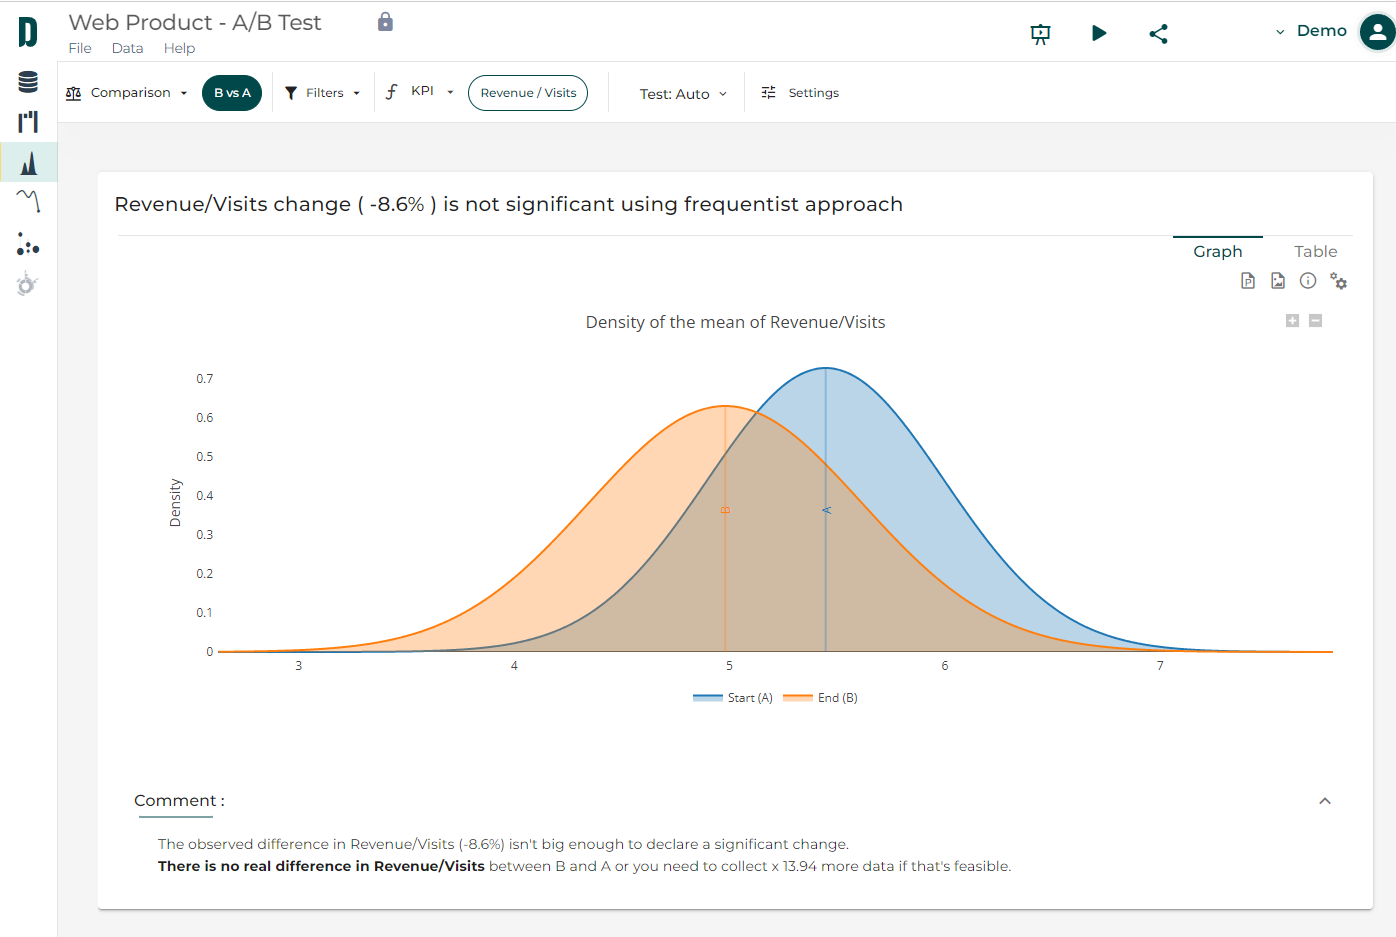
Datama Assess allows you to quickly assess the statistical significance of a difference on any KPI between two points
Datama Assess allows you to quickly assess the statistical significance of a difference on any KPI between two points
The significance of the difference can be assessed between two variants of an AB test, two periods of time, or basically anything you would like to compare.
You can define which segment you want to compare in the Comparison pill and which KPI you are assessing in the Metric pill,
Statistical significance is assessed using Statistical tests, and you can play with those tests and significance levels using the settings
💡If you don’t know what is Statistical Significance, here is a quick example:
-
Imagine you want to know what is the average age of male vs. female in your city.
-
You go outside and ask 10 males and 10 females for their age. You get an average of 50 years for Males, and 40 years for females. The average difference of age between males and females would be 20%.
-
But you obviously understand that this average is not statistically significant and you would be more confident in this datapoint if you would have asked more people about their age.
-
Well, the question of when you can be confident that this result is close to the real number is exactly the question of statistical significance 🤓
Tip of the week 149: Datama Assess tells you how significant your KPI changes are
When you’re tracking KPI variations between two periods (e.g., this week vs. last week), you usually know how much the KPI changed — but not how meaningful that change is compared to historical patterns.
That’s exactly what Datama Assess – Volatility helps with.
Let’s say your average basket dropped by x% from Week 45 to Week 46. With Assess, you can instantly compare this variation with previous week-to-week changes (Week 44 → 45, 43 → 44, etc.). This allows you to understand whether the drop is within the normal range — or whether it’s an outlier worth investigating.
🧠 In short: you stop reacting blindly to KPI movements and start knowing when they truly matter.
👉 Try it now on our website version or directly in the Datama extension (Looker studio, PowerBI, Tableau, and Qlik).
